
Driver Behavior Monitoring
See How They Drive. Coach Them to Drive Better.
Drivers control your fuel cost, your safety record, your customer satisfaction, and your insurance premiums. But without real-time behaviour data, you can’t tell your safest driver from your riskiest one until an accident report or a fuel bill forces the conversation.
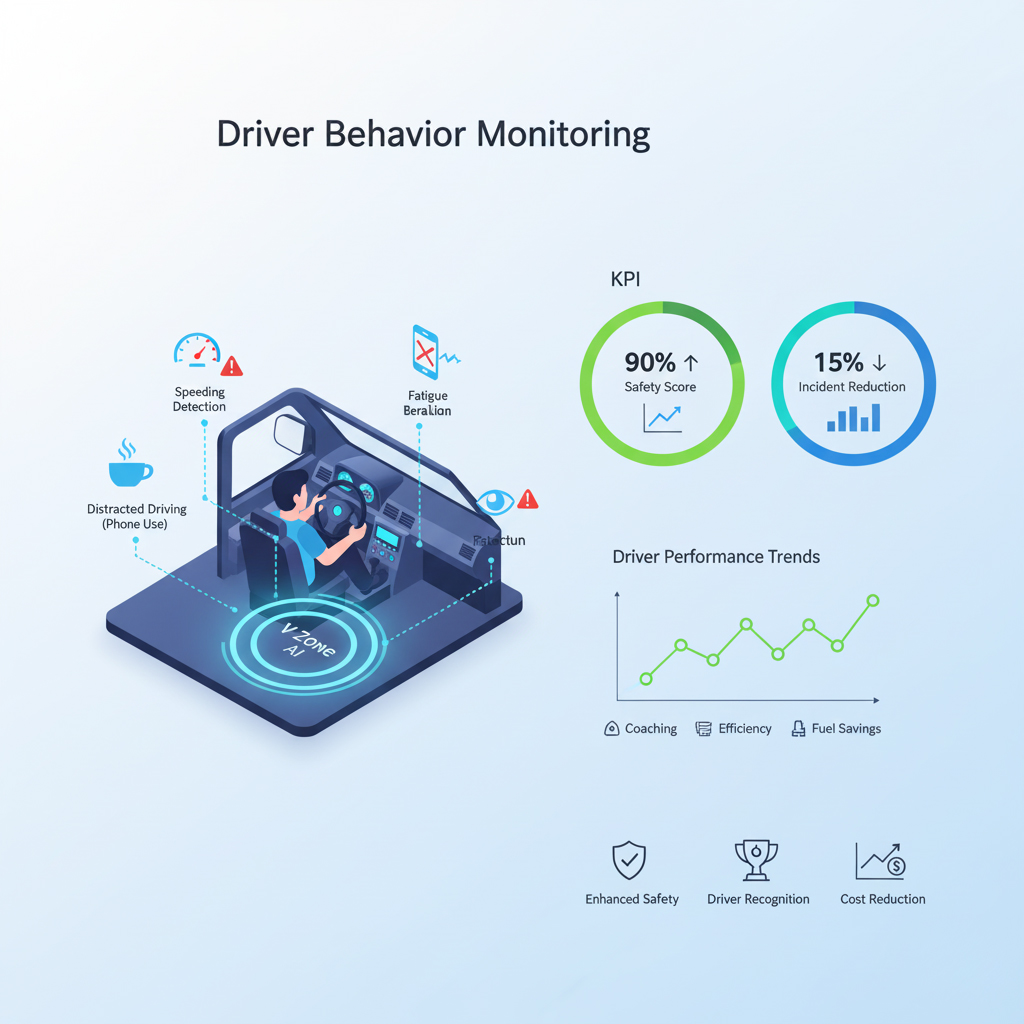
V Zone’s AI-Powered Driver Behavior Monitoring tracks overspeed, harsh braking, sharp cornering, fatigue, distraction, and idle time in real time assigning each driver a dynamic scorecard. The result: 30–60% fewer accidents, 12–20% fuel savings, and a coaching culture built on data instead of guesswork.
❗ Why Driver Behavior Monitoring Matters
Without behaviour data, fleet managers react to problems instead of preventing them. Fuel costs rise from harsh acceleration and excessive idling, accidents increase from overspeed and fatigue, insurance premiums stay high, and the difference between your best and worst drivers remains invisible:
- Fuel costs inflated by harsh acceleration and unnecessary idling
- Accident rates driven by overspeed, fatigue, and phone use
- Insurance premiums stay high without documented safety improvements
- No visibility into who your safest or riskiest drivers are
- Fleet vehicle misuse and unauthorised driving go unchecked
🎯 What We Monitor (Real-Time + Historical)
V Zone tracks eight driver behaviour metrics in real time combining GPS telemetry, CAN bus data, accelerometer readings, and AI dashcam analysis for a complete picture of how each driver operates:
| Behavior Metric | Description |
|---|---|
| Overspeeding | Configurable speed thresholds with tolerance zones per road type |
| Harsh Acceleration | Rapid throttle input scored by severity and frequency |
| Hard Braking | Sudden deceleration with GPS location and timestamp |
| Sharp Cornering | Lateral G-force monitoring for vehicle control assessment |
| Fatigue & Drowsiness | AI dashcam detection of eyelid movement and posture changes |
| Distraction Events | Mobile use, smoking, seatbelt status via video AI analysis |
| Idle Duration | Idle duration beyond configured business logic thresholds |
| Unauthorized Driving | No driver tag or mismatch in driver assignment |
🔍 How We Do It – Smart Data in Action
V Zone collects behaviour data from four sources, processes it in real time, and delivers actionable insights through scorecards, alerts, and coaching recommendations:
Multiple Inputs
GPS, CAN bus, smart accelerometers, and AI dashcams feed data continuously
Real-Time Alerts
Instant notifications for risky behaviours configurable by severity
Driver Scorecard
Each driver gets a dynamic score based on safety, eco-driving, and compliance
Trip-Based Behavioral Logs
Every incident tied to a specific trip with timestamp, location, and video clip
Coaching Recommendations
Automated coaching notes per driver based on top improvement areas
📈 Business Impact
Fleets that deploy V Zone’s driver behaviour monitoring see measurable improvements across fuel cost, accident rates, insurance premiums, and driver retention:
| Benefit | Measurable Outcome |
|---|---|
| Fuel Expense Reduction | ⬇️ 12–20% average across clients |
| Accident Rate | ⬇️ 30–60% with behavior-linked alerting |
| Insurance Cost | ⬇️ Premiums with safer fleet certification |
| Driver Retention & Motivation | ⬆️ Positive feedback with fair scoring |
| Fleet Reputation & Branding | ⬆️ Safer driving → Better customer reviews |
Results based on V Zone client deployments. Actual outcomes vary by fleet size and driver profile. All claims should be verified with V Zone.
📈 What You See on the Dashboard
V Zone’s behaviour dashboard gives fleet managers, safety officers, and HR teams a single view of driver performance across the fleet with leaderboards, trend analysis, and video evidence:
- Driver leaderboard ranked by score customisable KPIs
- Trip-based incident heatmaps showing where violations cluster
- Score trends over time weekly, monthly, quarterly
- Individual driver profiles with historical alert data
- Auto-generated safety coaching suggestions per driver
- Video evidence attached to flagged incidents (dashcam integration)
🎓 Build a Coaching Culture
V Zone’s behaviour module goes beyond monitoring it provides the tools to change driver habits over time through gamification, nudges, and rewards:
- Weekly and monthly driver rankings gamified leaderboards
- SMS or in-app coaching nudges triggered by incident patterns
- Incident review panels for supervisor-driver discussions
- Integration with incentive and reward programmes
- Optional compliance badge and driver certification system
🔐 For Every Industry & Driver Type
V Zone’s driver behaviour monitoring is designed for any fleet where driving quality directly impacts cost, safety, customer experience, or regulatory compliance:
- Last-mile and courier delivery fleets
- Passenger transport school buses, staff shuttles, taxis
- Oil & gas and hazardous goods transport
- Construction and heavy vehicle operations
- Government and public transport authorities
💬 Testimonials
🧠 Why V Zone?
V Zone’s behaviour monitoring is integrated into the fleet platform alongside GPS, fuel, trip playback, and compliance modules so every driver score is connected to real trip data, not isolated metrics:
- ✅ 15+ Years in driver behavior intelligence
- ✅ Trusted in government and regulated sectors
- ✅ Seamless integration with video, GPS, fuel, and trip modules
- ✅ Fully customisable scoring system weight events by your priorities
- ✅ Scalable from 10 drivers to 10,000+
🚀 Turn Every Trip Into Safer Driving
Empower your fleet to drive better for your brand, your bottom line, and your people.
💬 FAQs
How is the driver score calculated?
V Zone’s driver scorecard is calculated from a weighted combination of behaviour metrics: overspeed frequency and severity, harsh braking count, sharp cornering G-force, fatigue alerts, distraction events, idle time, and route compliance. Each metric carries a configurable weight so if your fleet prioritises fuel efficiency, you can increase the weight of harsh acceleration and idle time. Scores are updated after every trip and displayed as a 0–100 value on the dashboard. A score above 80 is considered safe; below 50 triggers a coaching recommendation. The weighting system is fully customisable per fleet, vehicle group, or industry.
Can drivers see their own scores?
Yes. V Zone’s driver mobile app includes a personal scorecard view where each driver can see their current score, trend over time, and the specific incidents that affected it. This transparency is essential for coaching drivers who can see their data understand what they need to improve. Fleet managers can also configure whether drivers see detailed incident breakdowns or just the overall score. Some V Zone clients use the driver-facing scorecard as part of incentive programmes, where drivers above a certain threshold receive bonuses or recognition.
How does AI dashcam detect fatigue and distraction?
V Zone’s AI dashcam uses computer vision to analyse the driver’s face in real time. For fatigue, the system monitors eyelid closure duration (PERCLOS method), yawning frequency, and head position changes. For distraction, it detects mobile phone use (hand near ear or screen), smoking, looking away from the road for extended periods, and seatbelt status. When a fatigue or distraction event is detected, the system triggers an in-cabin audio alert to the driver and sends a real-time notification to the fleet manager with a video clip of the event. Events are logged with GPS location and timestamp for the trip record.
Can I customise speed thresholds for different road types?
Yes. V Zone supports configurable speed thresholds per road type, zone, or geofence. For example, you can set 120 km/h as the threshold for highways (E11, E311, SZR), 80 km/h for urban roads, and 40 km/h inside warehouse or school zones. Tolerance zones can also be configured so a driver doing 125 km/h on a 120 km/h road gets a minor warning, while 140 km/h triggers a critical alert. Speed thresholds are set per vehicle group in the admin console and take effect immediately. This prevents false positives from one-size-fits-all speed rules.
How is this different from the Driver Scorecard Management solution page?
The Driver Scorecard Management solution page covers the strategic programme how V Zone approaches driver performance as a business capability, including reward structures, HR integration, incentive design, and fleet-wide benchmarking. This Driver Behavior Monitoring platform page covers the specific module mechanics how behaviour is detected (GPS, accelerometer, dashcam, CAN bus), how scores are calculated, how alerts fire, how coaching recommendations are generated, and how incidents are logged per trip. Think of the solution page as the “programme” and this platform page as the “engine under the hood.”