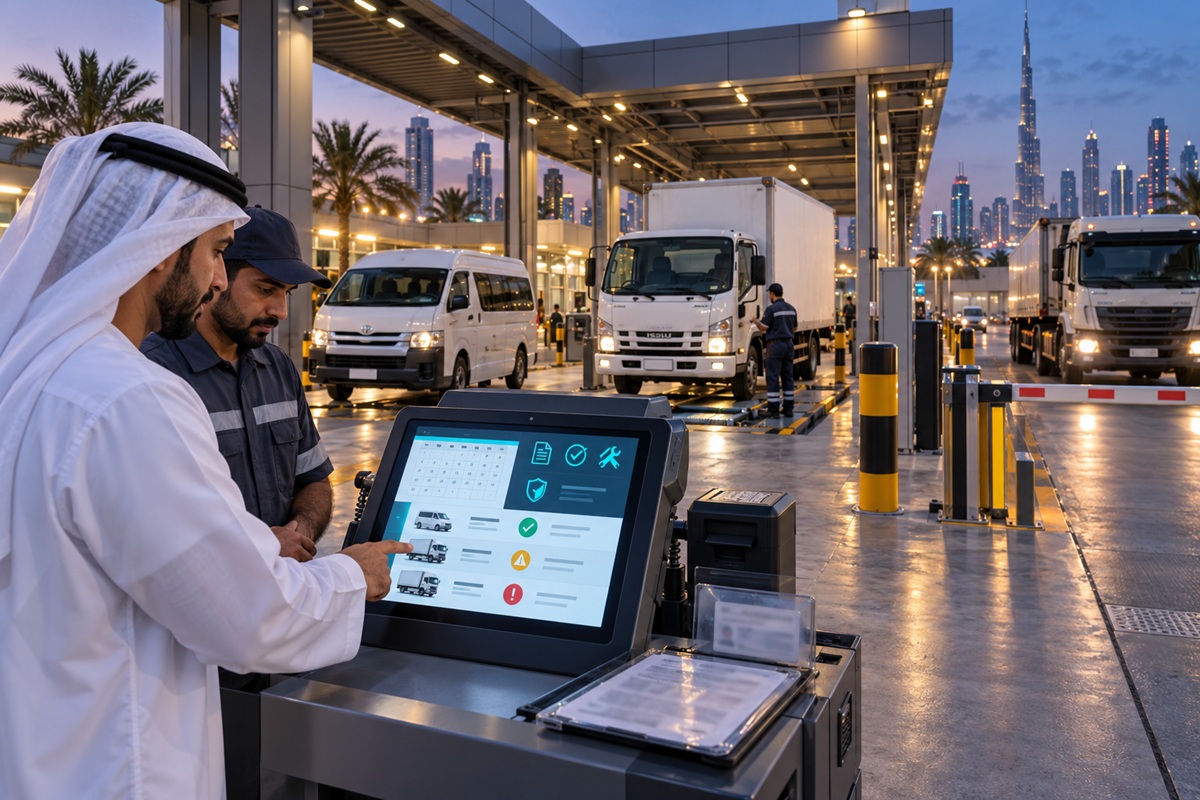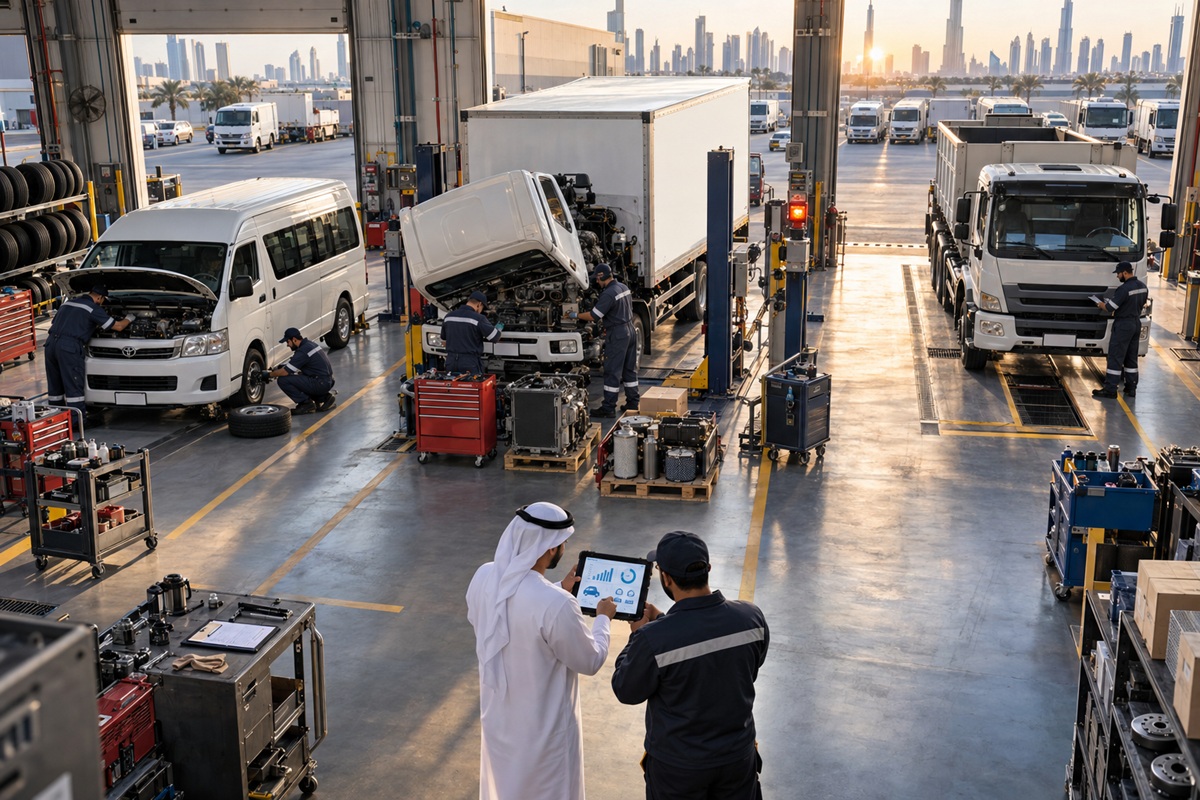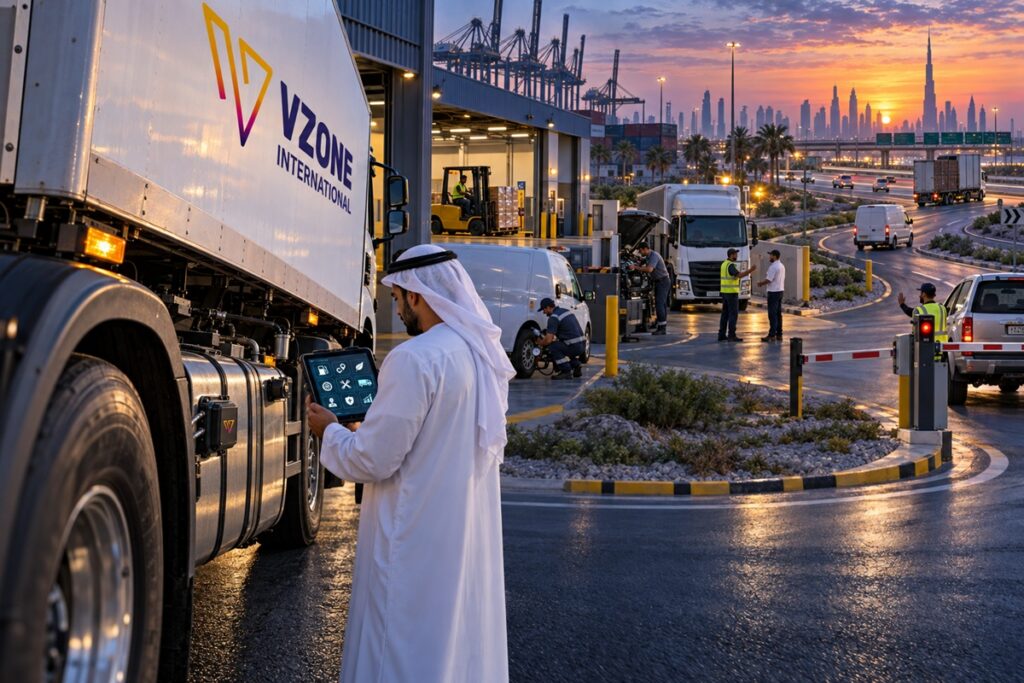
Fuel waste in a commercial fleet comes from four sources: idling (engine running with no vehicle movement), inefficient driving behaviour (harsh acceleration, braking, and speeding), poor routing (more kilometres than necessary to complete the same jobs), and theft or misuse (fuel that leaves the fleet without generating any operational output). The 10 methods below address all four sources from the cheapest behavioural changes to the technology tools that scale savings across large fleets.
Key Takeaways
- Small behavioural changes idling reduction and smoother acceleration are often the cheapest and fastest way to reduce fuel waste in a fleet, with savings visible within days of implementation.
- Technology-driven fixes (fuel monitoring, route optimisation) scale savings across large fleets that manual management cannot consistently monitor.
- Combining 3–4 of these methods compounds fuel waste reduction beyond what any single tactic achieves UAE fleets applying all 10 consistently achieve 20–30% total fuel cost reduction within 12 months.
1. Install a Fuel Monitoring System
A fuel monitoring system tracks real-time tank levels, flags siphoning events (rapid unexplained level drops), reconciles fuel card purchases against GPS vehicle locations, and calculates consumption per kilometre per vehicle.
It is the data foundation that makes every other method on this list measurable without it, you cannot confirm whether fuel waste reduction efforts are actually working. For UAE commercial fleets, fuel monitoring typically recovers 8 to 15 percent of annual fuel spend in the first month from theft and card misuse alone.
2. Reduce Idling Time
Engine idling ignition on with the vehicle stationary consumes 0.8 to 1.5 litres of fuel per hour depending on vehicle size, with zero operational output. UAE commercial fleets without idling management average 10 to 15 percent of total fuel on idling.
Configure GPS idling alerts at a 10-minute threshold (accounting for legitimate A/C cooling time) and communicate the policy to drivers before alerts activate the deterrence effect alone reduces idling 30 to 40 percent in the first week. An idling cost display on the driver app, showing AED spent on idling per trip in real time, further reinforces the behaviour change.
3. Coach Drivers on Harsh Braking and Acceleration
Harsh braking and rapid acceleration together account for 10 to 18 percent of excess fuel consumption in unmanaged fleets harsh acceleration uses more fuel than smooth acceleration to reach the same speed; harsh braking discards the kinetic energy that the fuel just purchased.
GPS accelerometer data identifies which drivers generate the most harsh events and on which road sections, enabling specific coaching conversations: ‘Your 9 harsh acceleration events this week were all on the Al Khail Road northbound try increasing your following distance on that stretch.’ Specific coaching produces 3 to 4 times more sustained behaviour change than generic ‘drive carefully’ instructions.
4. Optimise Delivery Routes
Route optimisation software calculates the most efficient multi-drop stop sequence simultaneously accounting for vehicle load capacity, delivery time windows, driver start location, and UAE-specific factors (Salik toll gate avoidance, prayer time delivery gaps).
Compared to experienced manual dispatcher planning, route optimisation reduces total fleet kilometres by 12 to 18 percent a direct fuel saving proportional to the distance reduction. For a 20-vehicle delivery fleet driving 300 km per vehicle per day, a 15 percent distance reduction saves approximately AED 82,500 per year in fuel cost alone, before Salik reduction.
5. Maintain Tyre Pressure and Vehicle Servicing
Under-inflated tyres increase rolling resistance, directly increasing fuel consumption a tyre 20 percent under-inflated increases fuel consumption by approximately 2 to 3 percent on that axle. In UAE summer conditions (June through September), tyre pressure rises in heat and drops after cooling; tyres should be checked at the cold-specification pressure before the vehicle’s first trip each day.
Engine air filter replacement at 5,000 km intervals (rather than the standard 10,000 km) in UAE’s dusty conditions maintains airflow efficiency, and engine oil changes at 5,000 km intervals during summer heat maintain lubrication efficiency both directly affecting fuel consumption per kilometre.
6. Monitor for Fuel Theft
Fuel theft physical siphoning from vehicle tanks and fuel card misuse for personal vehicles typically consumes 5 to 12 percent of the annual fuel budget in UAE commercial fleets without monitoring. Vehicle fuel level sensors detect siphoning as rapid unexplained tank level drops (without ignition-on events); GPS-to-fuel-card location reconciliation detects card misuse by comparing the GPS vehicle location at the transaction time against the card purchase location.
The deterrence effect of known monitoring stops the majority of theft immediately most UAE fleets that deploy monitoring and notify drivers simultaneously find that suspicious transactions drop to near zero in the first week without requiring any formal investigation.
7. Set Speed Limits and Enforce with Alerts
Fuel consumption increases significantly with speed most commercial vehicles achieve optimal fuel efficiency between 80 and 100 km/h, with consumption rising 15 to 25 percent above this range as aerodynamic drag increases with the square of speed.
GPS speed alerts configured at the posted road speed limit (not a fixed threshold) flag speed violations in real time to the driver via in-cab alert and to the fleet manager for weekly review. For UAE highway routes where the posted limit is 120 km/h, enforcing the limit also prevents the 140 km/h+ speed that many UAE commercial vehicle drivers maintain on E-roads recovering both fuel cost and safety performance simultaneously.
8. Right-Size Your Fleet for the Job
Operating a 3.5-tonne van on a route that a 1-tonne pickup could service uses approximately 40 to 60 percent more fuel per kilometre for the same operational output. GPS vehicle utilisation analysis identifies which vehicles in the fleet are operating below 60 percent utilisation and whether the underutilised vehicles are the wrong size for their assigned routes.
Fleet right-sizing matching vehicle type and capacity to route requirements reduces fuel consumption per stop without changing driver behaviour or route planning. It also defers procurement: identifying 3 to 4 underutilised vehicles in a fleet that ‘needs’ 5 new vehicles changes the procurement decision and the associated fixed cost.
9. Use Driver Scorecards to Track Progress
Driver safety scorecards weekly GPS-generated scores that normalise harsh event frequency per 100 km, enabling fair comparison between high-mileage and low-mileage drivers create the accountability and competitive dynamic that sustains fuel waste reduction beyond the initial coaching programme impact. Drivers whose scores are visible on a depot leaderboard have a social incentive to maintain efficient driving behaviour that direct management pressure alone does not create.
A monthly safety bonus (AED 150 to AED 300 for drivers maintaining scores above 80 for four consecutive weeks) converts the scorecard from a compliance tool into an engagement tool top-quartile drivers with financial skin in the game sustain their performance reliably.
10. Review Fuel Data Monthly
Fleet fuel data that is collected but not reviewed cannot drive continuous improvement. A structured monthly fuel review per-vehicle fuel cost per km against baseline, top 5 above-baseline vehicles for investigation, idling cost trend, card reconciliation exception count identifies the emerging waste patterns that the weekly operational review may miss. The monthly review should be compared against the prior 3 months to distinguish genuine deterioration from seasonal variation (UAE summer fuel consumption is legitimately 10 to 15 percent higher than winter from A/C load comparing June against June of the prior year is more informative than comparing June against January).
Fleet management software generates this report automatically from GPS and fuel card data; the monthly review is a 20-minute analysis exercise rather than a 3-hour data compilation exercise.
Conclusion
Reducing fuel waste in a fleet is cumulative each method adds its saving to the methods already in place rather than competing with them. The three highest-impact methods for most UAE commercial fleets, in order of implementation speed and return, are: idling reduction (fastest, no hardware required, visible within days), driver behaviour coaching with GPS scorecard data (largest absolute saving, requires 60 to 90 days for full coaching programme impact), and fuel monitoring system deployment (foundational for all other methods, recovers theft losses immediately). Starting with these three and adding the remaining seven over 6 to 12 months consistently delivers 20 to 30 percent total fuel cost reduction a compounding, sustainable saving rather than a one-time result.
VZone International Fleet Fuel Monitoring Reduce Fuel Waste Across Your UAE Fleet
VZone International’s fleet management platform provides all 10 fuel waste reduction tools: real-time fuel sensor monitoring, GPS idling alerts, driver safety scorecard, Salik-aware route optimisation, fuel card reconciliation, and monthly fuel efficiency reporting from a single platform deployment. Contact our team for a fleet fuel waste assessment for your UAE operation.
Frequently Asked Questions
The single highest-impact starting point for most UAE commercial fleets is deploying a fuel monitoring system because it is the data foundation that makes every other fuel waste reduction method measurable and sustainable. Without per-vehicle fuel consumption data, idling reduction efforts cannot be quantified, driver coaching cannot be data-specific, and theft cannot be detected. Fuel monitoring typically delivers the fastest measurable return (8 to 15 percent fuel budget recovery from theft and card misuse in the first month) while simultaneously enabling the other nine methods to be implemented with evidence rather than approximation.
Both are significant and partially overlapping. Idling waste engine-on with speed zero typically accounts for 10 to 15 percent of total fuel consumption in UAE commercial fleets without idling management, with summer A/C idling the largest category. Poor driving behaviour (harsh acceleration, harsh braking, and speeding) accounts for an additional 10 to 18 percent of fuel consumption above efficient-driving baselines. These two categories together represent 20 to 33 percent of total fleet fuel spend that is directly addressable through GPS monitoring and driver coaching without any change to routes, vehicles, or maintenance schedules. In practice, the same driver who idles excessively also tends to drive harshly, so coaching interventions that address both behaviours simultaneously are more efficient than addressing each separately.
Some fuel waste can be reduced without new technology primarily through policy enforcement (no idling rules, speed limit compliance reminders) and route planning review (manual assessment of whether delivery sequences are efficient). However, the reductions achievable without technology are limited by the absence of data: without GPS fuel monitoring, idling cannot be accurately quantified, driver behaviour cannot be objectively compared between drivers, fuel theft cannot be detected, and route inefficiency cannot be measured against an optimised alternative. Manual fuel management typically achieves 5 to 10 percent fuel waste reduction; GPS-enabled fuel management achieves 20 to 30 percent the technology gap is the measurement and accountability gap between intention and evidence.
Fuel data should be reviewed at two cadences. Weekly for the operational review that enables same-week coaching: driver safety scores, idling cost per vehicle, card reconciliation exceptions, and any vehicles showing significant above-baseline consumption this week. This weekly review catches waste while it is current and while the driver coaching conversation can reference events from the same week. Monthly for the strategic review that identifies trends and structural patterns: per-vehicle fuel cost per km against 3-month trend, seasonal comparison (June vs prior June), top vehicles for investigation, and budget vs actual variance. Most UAE fleet operators who have not previously reviewed fuel data at all find that the weekly review produces the fastest improvement in the first 3 months; once the programme is embedded, the monthly strategic review becomes the primary continuous improvement mechanism.