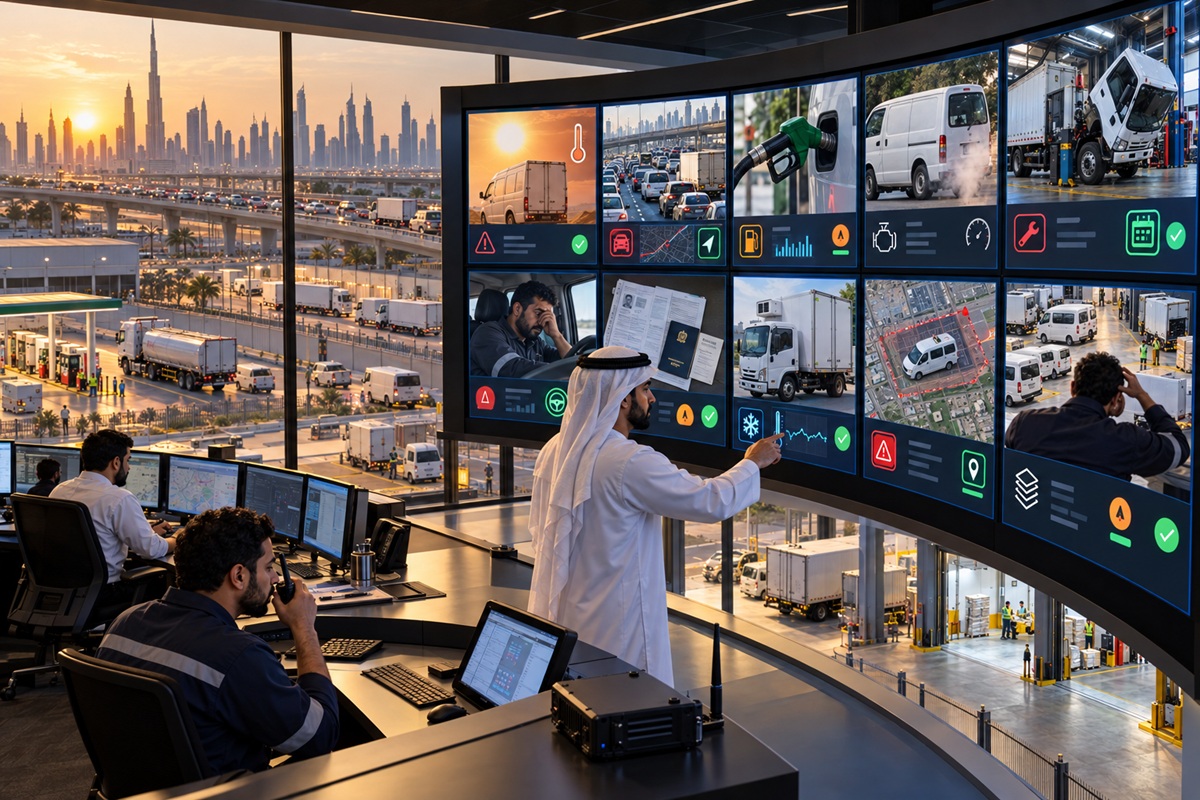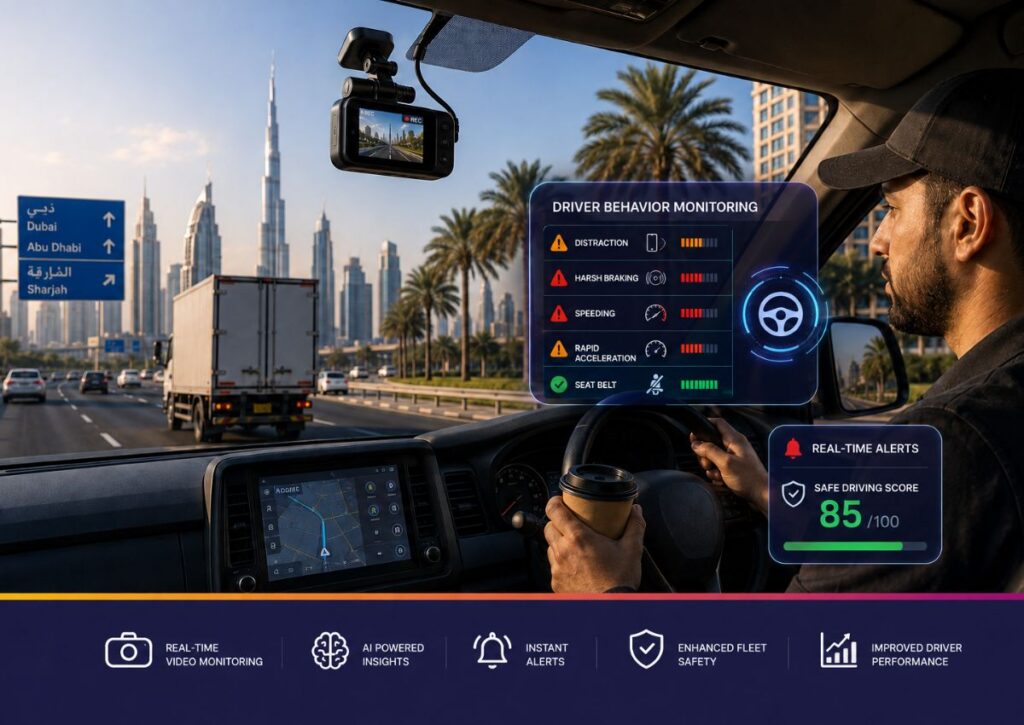
Every fleet accident in the UAE has a paper trail and increasingly, a video record. But the most effective fleet operators do not wait for accidents to generate that paper trail. They use real-time driver behavior monitoring to identify risky patterns before they produce costly incidents, and they use the data those systems generate to coach drivers toward sustained performance improvement rather than simply disciplining them after the fact.
Driver behaviour is responsible for the majority of commercial vehicle accidents in the UAE. Infrastructure quality, road design, and vehicle maintenance are controllable variables but the most consequential and most variable factor in fleet accident risk is driver behaviour in the moment: a driver who checks their phone at 120 km/h on the E311, a truck driver who has been awake for 18 hours approaching the Abu Dhabi industrial zone, a delivery driver who brakes hard repeatedly through dense Dubai traffic because their following distance is consistently too short. These are patterns, not isolated events, and patterns are detectable before they produce consequences.
This guide explains what driver behaviour monitoring captures, how real-time and post-trip monitoring differ in operational impact, how AI fatigue detection works in practice, how driver scorecards are constructed and used for coaching, and how VZone International’s monitoring platform supports both day-to-day fleet safety management and ADNOC IVMS compliance reporting in the UAE.
Key Takeaways
- Driver behaviour is the primary variable in commercial fleet accident risk and it is the variable that monitoring and coaching programmes directly address, unlike road conditions or vehicle specification.
- Telematics driver behaviour monitoring captures events across six primary categories: speeding, harsh braking, harsh acceleration, harsh cornering, seatbelt non-compliance, and idle time with AI dashcam integration adding fatigue and distraction detection.
- Real-time monitoring produces the in-cab alerts that prevent incidents; post-trip analysis produces the coaching data that improves behaviour over time. An effective programme requires both.
- Driver scorecards normalise behavioral event data into comparable performance scores enabling fleet managers to rank drivers by safety risk, target coaching at the highest-risk individuals, and track improvement over reporting periods.
- ADNOC IVMS reporting requires behavioral event data in HSE-formatted reports driver behaviour monitoring with IVMS-certified hardware satisfies this requirement as a natural output of normal fleet monitoring operations.
- Fleets that implement active driver behaviour coaching programmes not just monitoring hardware achieve accident rate reductions of 20 to 40 percent within 12 to 18 months of programme maturity.
What Is Driver Behaviour Monitoring?
Driver behaviour monitoring is the systematic collection, analysis, and reporting of data describing how drivers operate their vehicles. In fleet management, it refers specifically to telematics-based monitoring using GPS hardware, accelerometers, and AI cameras installed in fleet vehicles to capture driving events that correlate with accident risk and fleet operating cost.
The core value of driver behaviour monitoring is that it makes the invisible visible. Before telematics, a fleet manager’s knowledge of how their drivers behaved was limited to whatever the driver or a supervisor reported a fundamentally incomplete picture. Telematics monitoring creates an objective, continuous record of every trip: every speed event, every harsh brake, every time a driver’s eyes were closed too long. That record cannot be contested or selectively reported, and it scales across every driver in a fleet simultaneously without requiring supervisor presence.
Key Driving Events That Telematics Records
GPS telematics hardware captures driver behaviour events across six primary categories, each with direct connections to safety risk, operating costs, or regulatory compliance requirements.
| Behaviour Event | How It Is Detected | Primary Risk / Cost Impact | IVMS Reported? |
| Speeding below limit threshold (e.g. 10–20 km/h over) | GPS speed vs. road speed limit data | Elevated accident probability; insurance exposure | Yes |
| Speeding above limit threshold (e.g. 20+ km/h over) | GPS speed vs. configurable threshold | High accident and injury risk; regulatory exposure | Yes critical event |
| Harsh braking (above configured g-force) | Accelerometer longitudinal deceleration | Brake wear; rear-end collision risk; fuel waste | Yes |
| Harsh acceleration (above configured g-force) | Accelerometer longitudinal acceleration | Fuel overconsumption 15–25%; drivetrain wear | Yes |
| Harsh cornering (above configured g-force) | Accelerometer lateral g-force | Tyre wear; rollover risk on heavy vehicles; fuel | Yes |
| Seatbelt non-compliance | Seatbelt circuit monitoring | Injury severity in any collision; IVMS HSE KPI | Yes |
| Driver fatigue (AI camera eye tracking) | Driver-facing AI camera analysis | Microsleep risk; highest-severity accident cause | Yes advanced IVMS |
| Phone use / distraction (AI camera) | Driver-facing AI camera gaze analysis | Collision risk equivalent to 0.08 blood alcohol level | Yes advanced IVMS |
| Excessive idle time (above threshold) | Engine-on + zero-speed GPS data | Fuel waste; engine wear; carbon accumulation | Partial |
| Lane departure (forward-facing AI camera) | Road marking analysis forward camera | Fatigue/distraction indicator; collision risk | Supplementary |
How GPS Data and AI Camera Data Work Together
GPS telematics and AI camera systems capture different dimensions of driver behaviour that together produce a more complete safety picture than either source alone. GPS and accelerometer data captures vehicle dynamics: what the vehicle did its speed, direction changes, and g-force events. AI camera data captures driver state: what the driver was doing and experiencing their gaze direction, eye state, and physical actions.
The integration of these two data streams is where the most actionable insights emerge. A harsh braking event in GPS data tells a fleet manager that a driver braked hard at a specific location and speed. AI camera footage from the same event shows whether the driver was looking at the road, looking at their phone, or was visibly drowsy in the seconds before the event context that determines whether the coaching conversation focuses on following distance, phone use, or fatigue management. Without the camera dimension, behavioral coaching remains generic; with it, it becomes specific and evidence-based.
Real-Time vs. Post-Trip Driver Behaviour Monitoring
Driver behaviour monitoring operates across two time horizons real-time intervention during the trip and post-trip analysis for coaching and reporting and both are necessary for a complete safety programme. They serve different purposes and require different configurations.
| Feature | Real-Time Monitoring | Post-Trip Analysis |
| When alerts fire | Instantly during the trip | After trip ends in platform dashboard |
| In-cab driver alert | Yes audio/visual alert at moment of event | No driver not notified during trip |
| Fleet manager alert | Yes push notification to mobile/desktop | Yes dashboard report and scheduled digest |
| Fatigue detection | Yes AI camera live analysis | Yes event replay and trend review |
| Primary safety function | Prevents incidents through real-time intervention | Enables coaching through behavioral pattern analysis |
| Coaching value | Immediate behaviour correction high impact | Trend identification sustained improvement |
| IVMS compliance reporting | Continuous data capture satisfies IVMS | Report generation from captured data |
| Bandwidth requirement | Higher continuous transmission | Lower batch upload viable |
| Best used for | High-risk routes, ADNOC sites, fatigue-risk shifts | Coaching reviews, scorecard reporting, KPI tracking |
The operational implication is straightforward: real-time monitoring is the prevention mechanism and post-trip analysis is the improvement mechanism. A fleet that deploys only real-time alerts without post-trip coaching reviews creates a pattern of driver alerts that may be ignored as background noise without the reinforcement of structured feedback conversations. A fleet that analyses behaviour data only post-trip, without real-time in-cab alerts, misses the intervention window that prevents the incident from occurring in the first place. Both layers are required for a mature, effective driver safety programme.
Driver Fatigue Detection in UAE Fleets
Fatigue is consistently identified as one of the highest-severity risk factors in commercial fleet operations globally and UAE fleet operations have specific characteristics that elevate fatigue risk above the global average. Long-haul routes between UAE cities and cross-border routes to Saudi Arabia and Oman cover hundreds of kilometres of monotonous desert highway. Night-shift schedules for logistics and construction supply operations conflict with natural sleep cycles. Ramadan operating patterns during daylight fasting periods affect alertness levels across large portions of the driver workforce simultaneously. These are not generic risk factors they are UAE-specific operational realities that make fatigue detection technology particularly valuable in this market.
How AI Camera Detects Drowsiness Eye Tracking and Head Position
AI fatigue detection systems use the driver-facing camera to monitor three primary physiological indicators of drowsiness continuously: blink rate relative to baseline, blink duration, and head position relative to the normal driving posture. A driver who is becoming fatigued typically shows a reducing blink rate, then progressively longer individual blinks, then head nodding as muscle tone reduces during microsleep onset. The AI model recognises these patterns and triggers a graduated alert response an advisory alert for early drowsiness indicators, a more urgent audio alert for confirmed microsleep risk.
The threshold for a confirmed microsleep alert an eye closure duration of 500 milliseconds or more while the vehicle is in motion represents a genuine safety emergency. At 100 km/h, a 500-millisecond eye closure means approximately 14 metres of travel with no driver input. An alert that interrupts this event and prompts the driver to pull over or rest is directly preventing the kind of high-speed single-vehicle incident that causes the most fatalities in UAE commercial fleet operations.
Why Fatigue Is a Major Risk on UAE Long-Haul and Night Routes
Three operational patterns in UAE commercial fleet operations create elevated fatigue risk profiles. First, route monotony: the Abu Dhabi to Jeddah highway corridor and the UAE internal long-haul routes to Muscat and Al Ain involve extended periods of motorway driving at consistent speeds with minimal cognitive demand precisely the conditions under which fatigue accumulates fastest without the driver noticing the onset. Second, shift timing: early morning logistics shifts that begin at 3am to 5am coincide with the lowest point of the human circadian rhythm, when alertness is at its minimum regardless of prior sleep quality. Third, double-shift patterns: commercial pressure in logistics and construction transport sectors creates informal double-shift practices where drivers cover consecutive shifts with inadequate rest periods. Fatigue monitoring provides the operational visibility to identify these patterns at the fleet level and intervene before they produce a fatal incident.
Legal and Insurance Implications of Fatigue-Related Accidents in UAE
A fatigue-related commercial vehicle accident in the UAE creates liability exposure for both the driver and the fleet operator. UAE traffic law recognises driver fatigue as a contributing cause to accidents, and operators who cannot demonstrate that adequate fatigue management measures were in place face potential negligence findings in civil liability proceedings. An operator with a functioning fatigue monitoring programme including alert records showing that fatigue events were detected, that drivers were notified, and that management received alerts is substantially better positioned in both regulatory and civil proceedings than one without monitoring evidence.
From an insurance perspective, fatigue-related accident claims are among the most costly in the commercial vehicle segment typically involving serious injury, significant third-party property damage, and extended driver incapacitation. Insurers who see fatigue monitoring data as part of a fleet’s safety management programme, particularly when paired with a demonstrated record of fatigue event responses and driver rest compliance, factor this into renewal premium calculations. The monitoring data is both a safety tool and an insurance risk management document.
AI-Powered Driver Coaching From Data to Behaviour Change
Monitoring without coaching is an incomplete safety programme. The data that driver behaviour monitoring systems collect is only valuable if it drives behaviour change and behaviour change in adult professional drivers requires structured, evidence-based coaching conversations, not just automated alerts and disciplinary notices. The coaching programme is where the safety investment produces its sustained return.
How Driver Scorecards Are Calculated
Driver scorecards convert the raw event count data from behavioral monitoring into a normalised performance score that enables comparison across drivers, across time periods, and across different vehicle types and route profiles. The scoring methodology typically assigns point deductions for each event category, weighted by severity with critical events such as fatigue alerts and phone use receiving substantially higher deductions than lower-severity events such as minor idle time exceedances.
| Event Type | Severity | Points Deducted | IVMS Reported? |
| Speeding 10–20 km/h over limit | Medium | –5 per event | Yes |
| Speeding 20+ km/h over limit | High | –15 per event | Yes critical event flag |
| Harsh braking | Medium | –8 per event | Yes |
| Harsh acceleration | Low–Medium | –4 per event | Yes |
| Harsh cornering | Low–Medium | –4 per event | Yes |
| Phone use (AI detected) | High | –20 per event | Yes advanced IVMS |
| Driver fatigue alert advisory | High | –15 per event | Yes advanced IVMS |
| Driver fatigue alert critical (microsleep) | Critical | –25 per event | Yes critical event flag |
| Seatbelt not worn | High | –15 per event | Yes |
| Excessive idle time (>10 min) | Low | –2 per occurrence | Partial |
| Lane departure event | Medium | –6 per event | Supplementary |
Scorecards are calculated per trip, per shift, and per week with the weekly score being the primary coaching input. A driver who scores 95 out of 100 over a week had a near-perfect safety performance regardless of their score on any individual trip. A driver who scores 62 over the same period had a pattern of events that warrants a structured coaching conversation, not a blanket disciplinary response. The scorecard provides the context that makes the conversation productive.
Personalised Coaching Reports What They Include
AI-generated coaching reports for individual drivers present their event data in a structured format designed to facilitate a productive coaching conversation: event counts by category for the review period, ranking against fleet peers (anonymised where appropriate), trend comparison against the previous period showing improvement or deterioration, and for AI dashcam-equipped fleets, the two or three video clips from the period that best illustrate the most significant events.
The video clip component is the element that most consistently accelerates behaviour change. A driver who is shown a video of themselves using their phone at 110 km/h cannot attribute the event to a sensor glitch or a one-time road condition. The evidence is unambiguous and the coaching conversation can move directly to corrective commitment rather than being delayed by event contestation. Fleet safety managers consistently report that coaching sessions supported by video evidence produce faster and more durable behaviour change than those relying on event data alone.
Gamification and Incentive Programmes to Improve Safety Culture
Positive reinforcement is more effective than punitive monitoring alone in producing sustained behaviour change. The most successful fleet safety programmes pair driver scorecards with incentive structures that reward high performance fuel vouchers, safety bonuses, public recognition, or priority scheduling preferences for drivers who maintain high weekly scores over extended periods. Gamification elements leaderboards, streak rewards for consecutive high-scoring weeks, peer competition framing engage drivers in the safety programme as participants rather than subjects of surveillance.
In UAE fleet operations where driver retention is a persistent challenge and turnover is costly, a transparent, data-driven safety performance recognition system has an additional retention benefit. Drivers who are recognised for good performance through objective metrics feel more fairly treated than those in environments where recognition is supervisor-dependent. The safety programme becomes a retention tool alongside a safety tool a dual return on the monitoring investment that fleet safety managers can quantify in reduced recruitment and training costs.
Driver Scorecard Building Accountability Across Your Fleet
A driver scorecard programme is effective only when it is embedded in a consistent management process not deployed as a monitoring tool that generates reports no one reviews. The operational cadence that produces results is weekly scorecard review, monthly trend analysis, quarterly programme assessment, and a clear escalation process for drivers whose scores deteriorate despite coaching interventions.
Fleet-Level Scorecard Analysis Finding the Patterns That Matter
Beyond individual driver coaching, fleet-level scorecard analysis identifies systemic operational patterns that no amount of individual driver coaching will resolve. If a significant proportion of the fleet’s harsh braking events occur at the same section of road a known poorly-signed junction or a section with an unexpected speed limit change the issue is route design, not driver behaviour. If fatigue alerts cluster on specific shift patterns or route assignments, the issue is scheduling, not individual drivers. Fleet-level analysis separates behavioural patterns that coaching can address from operational patterns that require management intervention at the scheduling, routing, or infrastructure level.
Using Scorecard Data for Driver Development Not Just Discipline
The most common misapplication of driver scorecard data is using it as a disciplinary tool rather than a development tool. Drivers who receive scorecard data only in the context of warnings, performance improvement plans, or dismissal proceedings associate the monitoring system with punitive surveillance and that association undermines the safety culture that the programme is intended to build. Programmes that present scorecard data as development information ‘here is where you are performing well, here is where there is room to improve, here is the specific coaching support available’ achieve faster and more durable behavioural improvement than those that reserve scorecard discussion for disciplinary contexts.
How VZone International’s Driver Monitoring Platform Works
VZone International’s driver behaviour monitoring capability is built on the Wialon and FMSiTrack enterprise platforms, integrating GPS telematics hardware, AI dashcam systems, and IVMS-certified devices into a unified driver performance management interface. The platform serves fleet safety managers from real-time incident alerts through weekly scorecard reports to monthly HSE trend documentation for ADNOC audit purposes.
Real-Time Dashboard and Mobile Manager App
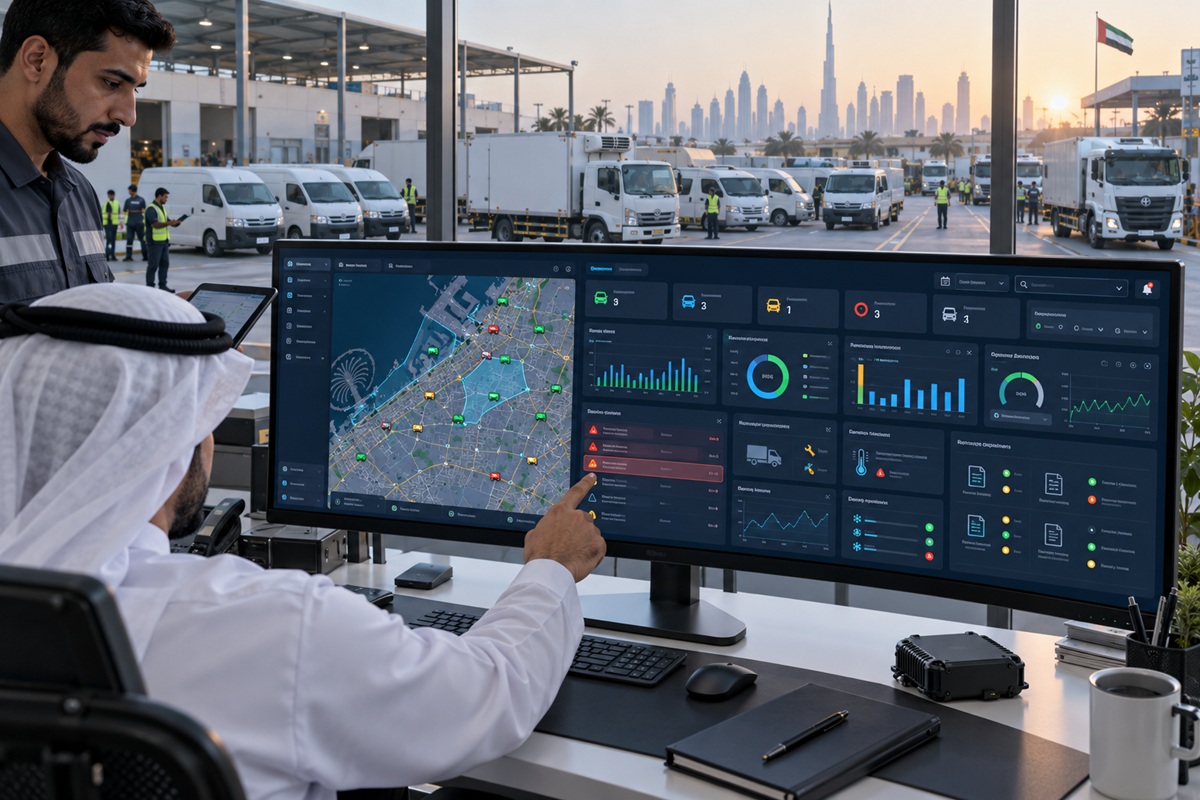
VZone’s platform delivers driver behaviour alerts through both a web-based fleet manager dashboard and a mobile application that enables operations managers to receive push notifications and review event details on any device, anywhere. Real-time alerts for critical events fatigue alerts, phone use detections, severe speed threshold violations are delivered within seconds of the event, enabling immediate phone contact with the driver or dispatch of a supervisor to the vehicle’s GPS-confirmed location if the situation warrants intervention.
The dashboard presents fleet-wide safety status at a glance: current high-risk events in the field, today’s scorecard leaders and bottom performers, vehicles with active compliance alerts, and pending coaching actions from previous periods. Role-based access controls ensure that depot supervisors see their assigned vehicles, safety managers see fleet-wide trend data, and senior management sees the KPI summary without navigating detailed event logs.
AI Dashcam and IVMS Integration for Oil and Gas Compliance
For ADNOC contractor fleets, VZone’s driver monitoring platform integrates GPS behavioral data from IVMS-certified hardware with AI dashcam event data to produce the most comprehensive HSE-formatted driver safety report available in the UAE market. Standard IVMS reports cover speed events, g-force driving behaviours, and seatbelt compliance. AI dashcam integration adds fatigue alerts and distraction events with video clip evidence to the same ADNOC-formatted report structure. The combined record positions contractor fleets ahead of the evolving ADNOC HSE expectation for fatigue and distraction evidence in contractor performance reviews.
Fleet-Wide Trend Reports Monthly Safety KPIs
VZone’s platform generates monthly fleet-wide safety KPI reports that present driver behaviour performance at the level of detail that senior fleet management, HSE directors, and ADNOC audit respondents require: fleet-wide event rate trends, period-on-period improvement percentages, individual driver coaching completion status, and incident correlation analysis that links behaviour event rates to actual accident and near-miss occurrences. These reports are generated automatically from platform data without manual compilation available on schedule at the end of each reporting period without requiring analyst time to produce.
Common Driver Behaviour Monitoring Mistakes UAE Fleet Operators Make
Mistake 1 Monitoring Without a Coaching Process
The most prevalent and costly driver behaviour monitoring failure is treating hardware deployment as the endpoint rather than the starting point. A fleet with comprehensive telematics data and no structured coaching programme generates reports that confirm problems without resolving them. The safety improvement and the ROI comes from the coaching process that converts data into behaviour change. Fleet operators who deploy monitoring hardware without establishing the management process to act on the data consistently underdeliver against their safety improvement objectives.
Mistake 2 Setting Alert Thresholds Too Broadly
Alert threshold configuration requires calibration to the specific operating environment. A harsh braking threshold set too low for urban delivery operations generates hundreds of alerts daily most of them from normal stop-and-go traffic flooding the operations manager with notifications that become background noise and training drivers to ignore in-cab alerts as false positives. Thresholds should be calibrated to the actual operating environment: tighter for highway long-haul routes where all harsh events are anomalous, broader for urban delivery routes where some level of reactive braking is operationally normal.
Mistake 3 Treating All Drivers Identically
Fleet-wide training programmes that address driver behaviour at aggregate level safety days, general awareness campaigns, mass communications about speeding policy have consistently lower impact than targeted coaching of the specific drivers whose scorecard data identifies them as the highest-risk performers. The 80/20 principle applies strongly in driver behaviour data: typically 15 to 20 percent of drivers generate 60 to 70 percent of the fleet’s total high-severity event count. Allocating coaching resources disproportionately to this group produces safety improvements that fleet-wide programmes cannot match at the same cost.
Conclusion: Driver Behaviour Monitoring Works When the Data Drives Action
Driver behaviour monitoring technology in 2026 is operationally proven, commercially accessible, and directly connected to the safety and financial outcomes that UAE fleet operators care about most. The monitoring hardware captures the data. The AI analysis identifies the patterns. The coaching programme converts those patterns into sustained behaviour change. And the combined effect accident rate reduction, insurance premium improvement, IVMS compliance documentation delivers a measurable return on the technology investment.
The fleet operators who achieve the strongest results are those who treat driver behaviour monitoring not as a surveillance system but as a safety management infrastructure one that provides objective data for coaching conversations, creates accountability that is fair because it is evidence-based, and builds a safety culture in which good performance is recognised and rewarded rather than only poor performance penalised.
The starting point is deploying monitoring capability that captures the full behavioral picture: GPS telematics for vehicle dynamics, AI dashcam for driver state, and IVMS-certified hardware for regulatory compliance. The return on that investment depends on what the organisation does with the data and organisations that use it actively, consistently, and constructively consistently achieve safety improvements that make the investment self-funding within the first year.
Want to reduce accidents and insurance costs across your UAE fleet?
VZone International provides driver behaviour monitoring and AI coaching solutions for UAE commercial fleets GPS telematics, AI dashcam integration, driver scorecards, and ADNOC IVMS-compatible HSE reporting on the Wialon and FMSiTrack enterprise platform. Get a free driver behaviour monitoring demo and see your drivers’ safety scores in real time.
Frequently Asked Questions
Driver behaviour monitoring in UAE fleets uses GPS telematics hardware installed in vehicles to capture speed events, harsh braking, acceleration, and cornering data in real time. AI dashcam integration adds fatigue and distraction detection through driver-facing camera analysis. Events are transmitted continuously to a cloud platform where fleet managers see live alerts, driver scorecards, and trend reports. In-cab audio alerts notify drivers of risk events at the moment they occur.
Driver behaviour analytics reduces accidents through two mechanisms: real-time in-cab alerts that interrupt dangerous behaviour before incidents occur, and post-trip coaching based on individual driver event patterns that produces sustained behaviour change. Fleets with active coaching programmes using analytics data to target the highest-risk drivers with specific, evidence-based intervention consistently achieve accident rate reductions of 20 to 40 percent within 12 to 18 months of programme maturity.
AI fatigue detection uses the driver-facing camera to monitor eye state continuously tracking blink rate, blink duration, and head position against baseline measurements. Drowsiness produces a characteristic pattern: progressively longer blinks, reducing blink rate, and head position changes as muscle tone decreases. An advisory alert fires when early drowsiness indicators are detected. A critical alert fires when a microsleep event eye closure of 500 milliseconds or more while in motion is confirmed. Both alert levels trigger simultaneous in-cab audio notification and fleet manager dashboard notification.
Yes. ADNOC contractor HSE standards require IVMS In-Vehicle Monitoring System for vehicles operating on ADNOC sites. IVMS captures driver behaviour event data including speed violations, harsh braking, acceleration, and seatbelt compliance, and generates HSE-formatted reports that ADNOC auditors review during contractor performance assessments. AI dashcam integration that adds fatigue and distraction detection produces an advanced IVMS record that exceeds the standard IVMS data package and positions contractor fleets ahead of evolving ADNOC HSE requirements.
VZone International provides driver behaviour monitoring solutions across UAE and GCC integrating GPS telematics, AI dashcam systems, and IVMS-certified hardware on the Wialon and FMSiTrack enterprise platforms. VZone's solution covers real-time driver alerts, automated driver scorecards, personalised coaching reports, and ADNOC-compatible IVMS HSE reporting, with UAE-based implementation and support teams serving logistics, oil and gas, construction, and transport fleet sectors.
The monitoring effect improved driver behaviour resulting from awareness of monitoring typically produces measurable event rate reductions within the first two to four weeks of system deployment, before any coaching programme begins. Structured coaching programmes that use behavioral data to target the highest-risk drivers produce sustained safety improvement over a three to six month period. Accident rate reduction, which is the lagging indicator of safety programme effectiveness, typically becomes statistically significant at 12 to 18 months of sustained programme operation.