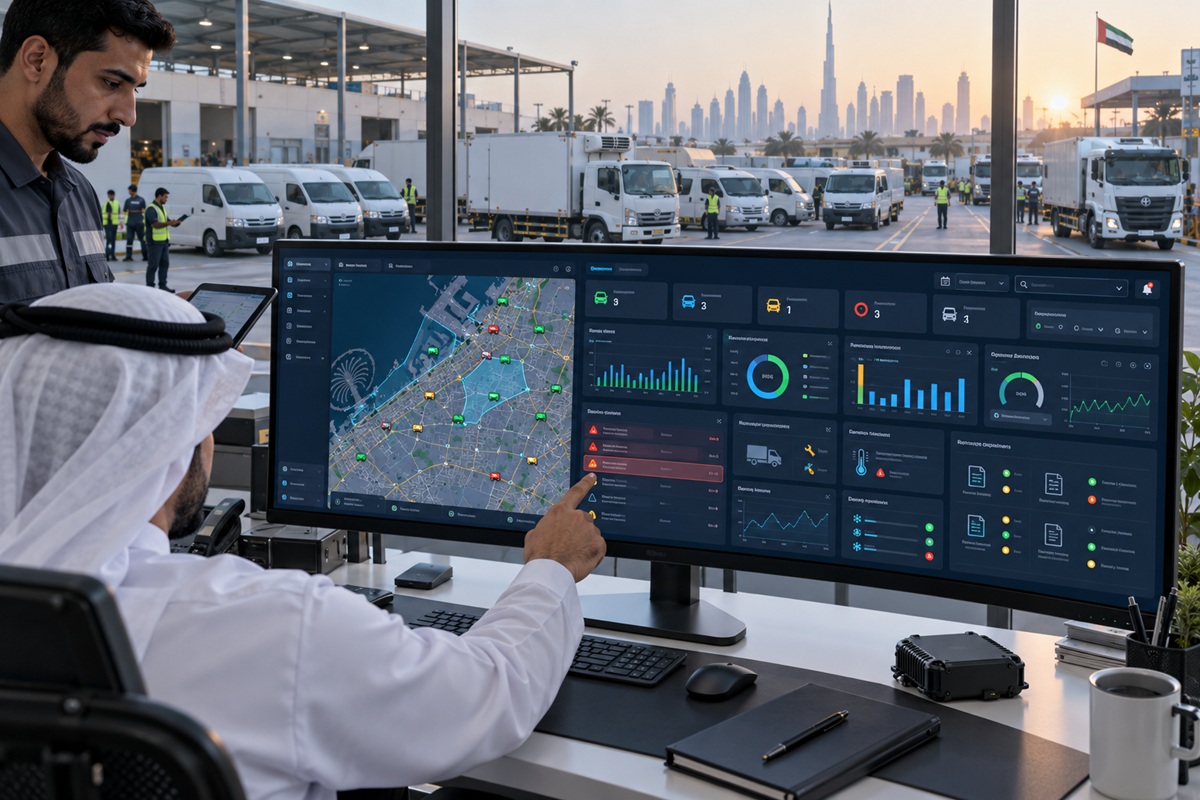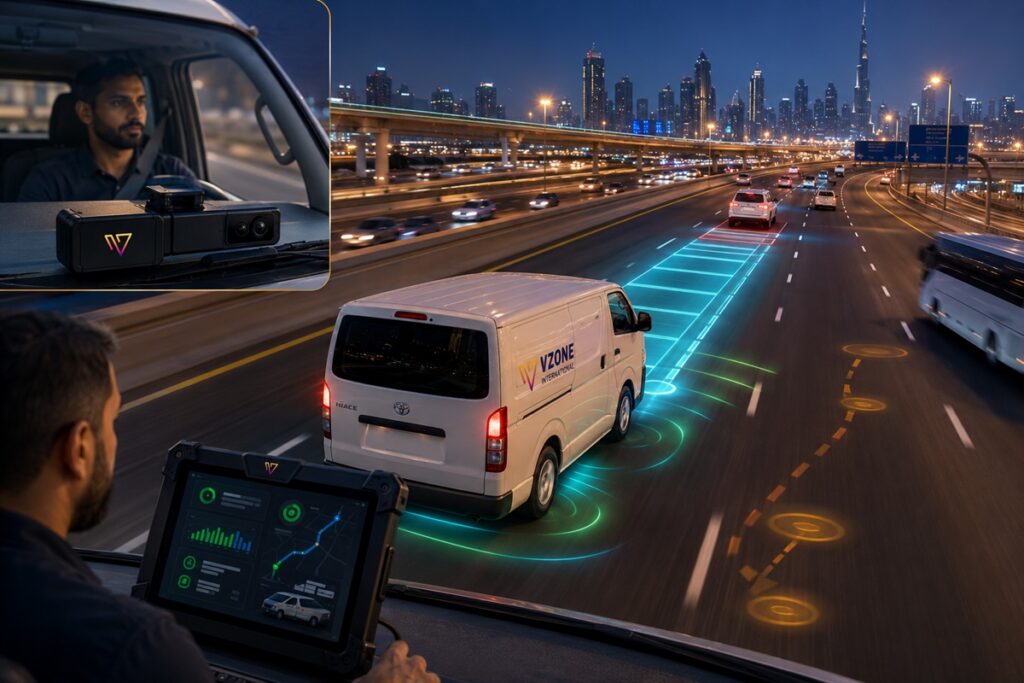
Driving behavior tracking is the single highest-ROI feature inside any fleet management system. UAE roads see over 5,000 commercial vehicle incidents annually and the majority trace back to three behaviors that GPS and AI technology can detect in real time: speeding above posted limits, harsh braking from following too close, and distracted driving from phone use or fatigue. A car GPS tracker system with built-in driving behavior tracking scores every trip automatically, flags the highest-risk drivers by name, and gives fleet managers the specific event data needed to intervene with targeted coaching before the behavior pattern becomes an accident.
VZone International’s AI driver scoring goes further than standard event counting it analyses behavior patterns across trips and routes to identify the drivers and route segments where risk is accumulating before the incident frequency is high enough to appear in accident statistics. Combined with ADNOC IVMS compliance reporting, insurance telematics data package generation, and fatigue detection from driver-facing IR cameras, VZone’s driving behavior tracking is the comprehensive driver safety management system that UAE commercial fleet operators need in 2026.
Key Takeaways
- Driving behavior tracking monitors speeding, harsh braking, rapid acceleration, sharp cornering, seatbelt compliance, idle time, and distraction events scoring each driver on every trip and generating weekly performance reports that fleet managers use for targeted coaching conversations.
- The accident reduction from systematic driving behavior tracking with coaching is 30 to 40 percent over 12 months not from surveillance alone, but from the feedback loop: real-time in-cab alerts when events occur, weekly scorecard review, and specific coaching conversations that address individual drivers’ actual event patterns rather than generic safety briefings.
- Fuel savings from driving behavior tracking average 15 to 25 percent because the aggressive acceleration and speed patterns that produce the most harsh braking events also consume 20 to 30 percent more fuel per kilometre than smooth, consistent driving the same behavior change that makes driving safer also makes it more fuel-efficient.
- UAE commercial vehicle insurance carriers accept GPS driving behavior data driver safety scores, harsh event frequency, accident-free period documentation as evidence of reduced fleet risk, typically enabling 10 to 20 percent premium reduction at renewal for fleets that present comprehensive telematics data packages.
- ADNOC IVMS compliance for contractor vehicle fleets requires driver behavior event reporting in a specific format driving behavior tracking is not optional for ADNOC contractor operations; it is a mandatory data submission requirement that determines contractor vehicle access to ADNOC facilities.
What Is Driving Behavior Tracking?
Driving behavior tracking is the automated monitoring, recording, and scoring of a vehicle operator’s driving conduct throughout every trip using GPS speed data and accelerometer measurements to detect and quantify the specific driving behaviors that are statistically associated with elevated accident risk and excess fuel consumption. The system identifies and logs each event, assigns a weighted penalty to the driver’s trip score based on the event’s severity, and generates per-driver performance reports that enable fleet managers to identify their highest-risk drivers by name and address their specific behavior patterns through structured coaching.
The monitored events fall into two categories: safety events (speeding, harsh braking, rapid acceleration, sharp cornering, seatbelt non-compliance, and with AI dashcam phone use and fatigue indicators) and efficiency events (excessive idling, aggressive acceleration that wastes fuel, and route deviations that add unnecessary kilometres). Both categories affect the driver’s safety score, but safety events carry higher penalty weighting in the scoring algorithm because their consequences are potentially severe rather than merely financially wasteful.
How a Car GPS Tracker System Captures Driving Behavior Data
The primary sensor for driving behavior tracking in a car GPS tracker system is the three-axis accelerometer embedded in the GPS telematics device a component that measures acceleration forces in the lateral (cornering), longitudinal (braking and acceleration), and vertical (road surface quality) axes simultaneously at 100 to 1,000 times per second. When the measured acceleration force in any axis exceeds a configured threshold for example, 0.4g for harsh braking, 0.35g for harsh acceleration, or 0.45g for sharp cornering the system records a behavior event with the precise timestamp, GPS location, and magnitude of the force.
GPS speed data adds the speeding detection layer: the telematics device compares the vehicle’s GPS-measured speed against the posted speed limit for the road segment the vehicle is on (from a map database), firing a speed event when the vehicle exceeds the limit by a configured margin. The combination of accelerometer-detected physical events and GPS-detected speed events produces a comprehensive behavior record for every trip without requiring the driver to take any action and without depending on self-reporting.
How Driving Behavior Tracking Works Inside a Fleet Management System
Data Collection, Scoring, and Driver Report Cards
The driving behavior tracking workflow in a fleet management system follows four stages from sensor to scorecard. Raw accelerometer and GPS data is collected by the car GPS tracker system device throughout every trip. The fleet management platform’s scoring engine processes the raw event data against configured thresholds and penalty weights each harsh braking event above the threshold reduces the driver’s trip score by a configured amount; a speeding event above 20 km/h over the limit carries a higher penalty than a 5 km/h excess. The scored trip data is aggregated into a weekly driver safety score a composite metric that reflects the driver’s average performance across all trips in the week, weighted by event type and severity. The weekly scorecard is generated automatically and distributed to the fleet manager and, in many fleet coaching programmes, to the driver directly enabling self-review before the coaching conversation.
Real-Time Alerts vs End-of-Day Summaries
Driving behavior tracking systems deliver data through two complementary channels with different operational purposes. Real-time in-cab alerts an audible tone or voice message that fires within 2 to 3 seconds of a detected event provide immediate feedback to the driver during the trip, creating the in-moment awareness that modifies behavior on the current journey. Studies of fleet behavior tracking programmes consistently show that real-time alerts produce faster behavior change than weekly scorecard review alone the feedback is temporally connected to the behavior, making the cause-and-effect relationship immediate rather than retrospective. End-of-day and weekly summary reports provide the structured data for the coaching conversation: which events occurred, on which routes, at what times, and how the driver’s performance compares to the fleet average and their own prior weeks.
Gamification and Driver Leaderboards
Driver leaderboards ranking all fleet drivers by their safety score in a format visible to the driver population introduce competitive motivation that individual scorecard review does not. When drivers can see their rank relative to colleagues on the same vehicle type and route, the score becomes a performance metric with social context rather than just a management assessment. UAE fleet operators who introduce leaderboard-based driver safety competitions with monthly awards for top-ranked drivers consistently report faster initial score improvement and sustained engagement with the coaching programme compared to fleets that use scorecards without competitive context. The leaderboard approach should be implemented with sensitivity to the driver population’s cultural preferences and with clear communication that the purpose is positive recognition rather than punitive ranking.
5 Dangerous Driving Behaviors a Car GPS Tracker System Detects
1. Speeding Above Posted Limits
Speeding is the behavior most consistently associated with severe accident outcomes in UAE commercial vehicle accident data not just because higher speeds increase collision energy but because speeding on UAE highways is often combined with insufficient following distances that reduce the reaction time available to respond to hazards. The car GPS tracker system detects speeding by comparing GPS-measured vehicle speed against the posted speed limit for each road segment in real time generating an event when the vehicle exceeds the limit by a configured threshold margin (5 km/h excess for school zones and residential areas; 15 km/h for highway segments where brief speed variation is operationally normal). Speed event frequency per driver provides the coaching data that identifies whether speeding is a habitual pattern on specific route types or an occasional response to specific traffic conditions.
For UAE commercial fleets operating on federal highways with 120 km/h limits and Abu Dhabi urban roads with 60 to 80 km/h limits, the speed limit database accuracy in the GPS map layer is critical incorrect speed limit data generates false alerts on roads where the map limit is outdated relative to current signage. VZone International uses a UAE-specific map database with regular updates to minimise false speed alerts from outdated limit data.
2. Harsh Braking Events
Harsh braking deceleration above the configured g-force threshold, typically 0.35g to 0.45g is the most common indicator of insufficient following distance and the behavior most directly preventable through coaching. A driver who brakes harshly in response to a vehicle stopping ahead was not maintaining a following distance adequate for the approach speed; the harsh braking event is the evidence that their gap management was insufficient at that moment. Systematic harsh braking data by driver and route segment enables fleet managers to identify both individual driving style issues (drivers who consistently brake harshly on specific road types) and route-level hazard patterns (junction or roundabout approaches where multiple drivers generate harsh braking events indicating a route design or signage issue rather than individual behavior).
For UAE fleet insurance purposes, harsh braking event frequency per vehicle is one of the data points that insurers weight most heavily in telematics-based premium assessment a vehicle with zero harsh braking events over a 12-month period presents a significantly different actuarial risk profile from one with 15 harsh braking events per 1,000 km.
3. Rapid Acceleration
Rapid acceleration acceleration above the configured g-force threshold consumes 20 to 30 percent more fuel per kilometre than smooth, controlled acceleration to the same final speed, because aggressive acceleration requires significantly higher fuel injection rates during the acceleration phase and the higher speed reached often requires braking to a lower speed shortly after. The fuel cost of a driver who accelerates aggressively from every stop on a 25-stop urban delivery route adds AED 8 to AED 15 per day in excess fuel consumption compared to the same driver making the same route with smooth acceleration AED 2,000 to AED 3,750 per year per vehicle from a single behavior pattern that coaching can address.
Rapid acceleration events are also a safety indicator in specific contexts: heavy vehicles that accelerate rapidly after turning from side roads onto main roads, or vehicles that accelerate rapidly after overtaking other vehicles, create hazardous closing speed situations for following traffic. The GPS location context of each rapid acceleration event enables the fleet manager to distinguish between aggressive general driving style and situation-specific acceleration patterns that correlate with specific route hazards.
4. Sharp Cornering and Lane Swerving
Sharp cornering lateral acceleration above the configured threshold indicates either excessive approach speed at bends and junctions or sudden evasive steering that suggests the driver was not anticipating the road geometry. For heavy commercial vehicles where high cornering forces create rollover risk particularly refrigerated trucks, tankers, and coach buses with elevated centres of gravity sharp cornering event detection and immediate in-cab alerts are the primary telematics intervention against one of the most severe commercial vehicle accident types. For lighter vehicles, cornering events indicate aggressive driving style that, while less catastrophic in isolation, contributes to tyre wear, passenger comfort issues, and the general driving pattern that correlates with higher accident rates.
5. Excessive Idling and Unauthorised Stops
Excessive idle time detection identifies vehicles that are running with the engine on but making no progress flagging extended stops that exceed the configured threshold (typically 5 to 10 minutes for urban delivery, 15 to 20 minutes for long-haul operations where rest break idling is operationally necessary). In UAE summer conditions, idling consumes 1.5 to 2.5 litres per hour for air-conditioning maintenance making idle time a significant and measurable fuel cost component that coaching and threshold alerts can reduce by 30 to 50 percent in systematic programmes. Unauthorised stop detection vehicle stationary at a GPS location not matching any scheduled delivery stop or known depot location during operating hours combines idle detection with geofencing to identify potential personal errands, unauthorized breaks, or vehicle misuse that pure idle time monitoring cannot distinguish from legitimate operational stops.
The ROI of Driving Behavior Tracking for UAE Fleets
| ROI Category | Mechanism | Conservative Saving Rate | Annual Saving 100-Vehicle Fleet (AED) |
| Accident cost reduction | 30-40% fewer at-fault incidents from coaching-driven behavior improvement | 35% incident reduction from 8 incidents/year at AED 22,000 average cost | AED 61,600 |
| Fuel savings eco-driving | Smooth acceleration/deceleration reduces fuel consumption per km | 15% fuel reduction on AED 5,000/vehicle/month spend | AED 900,000 |
| Fuel savings idle reduction | Real-time idle alerts reduce UAE summer A/C idle time by 35% | 3% of fuel spend recovered from idle reduction | AED 180,000 |
| Insurance premium reduction | Telematics data enables 12% first-renewal premium reduction | 12% on AED 12,000/vehicle/year premium | AED 144,000 |
| Tyre and brake life extension | Reduced harsh braking and cornering events extend tyre life by 15-20% | AED 800/vehicle/year tyre and brake saving | AED 80,000 |
| Fraudulent claim defence | GPS behavior data defends against inflated third-party claims | 2 defended claims/year at AED 35,000 average avoided settlement | AED 70,000 |
| TOTAL ANNUAL SAVING | AED 1,435,600 |
ROI Summary 100-Vehicle UAE Fleet Total 24-month investment (driving behavior tracking module, hardware, installation, subscription): AED 480,000Total annual saving (conservative): AED 1,435,600Payback period: 4.0 months24-month net ROI: AED 2,391,200Note: Conservative rates applied. Actual savings depend on current fleet behavior baseline, coaching programme implementation, and incident history. Fuel saving rates assume 15% eco-driving improvement; actual range is 15-25% in UAE fleet deployments with systematic coaching. |
How to Implement Driving Behavior Tracking in Your Fleet Management
| 1 | Install a Car GPS Tracker System with Accelerometer The car GPS tracker system device must have an onboard three-axis accelerometer to detect lateral, longitudinal, and vertical g-forces the hardware layer for harsh braking, acceleration, and cornering detection. Plug-in OBD-II devices provide basic accelerometer data; hardwired devices with calibrated accelerometer mounting provide more accurate event detection because the device is fixed relative to the vehicle’s axis. For ADNOC IVMS compliance, hardwired installation by a certified installer is mandatory. VZone International deploys Teltonika devices with factory-calibrated accelerometers as the standard hardware for driving behavior tracking deployments calibration ensures that the configured g-force thresholds correspond to the actual vehicle dynamics at each threshold level. |
| 2 | Set Behaviour Thresholds and Scoring Rules Configure the event detection thresholds appropriate to your fleet’s vehicle types and route profiles before the first scored trip. A delivery van operating in urban Dubai with frequent stop-start traffic requires different harsh braking thresholds from a long-haul truck on Abu Dhabi highways the same g-force that represents emergency braking on a highway is normal deceleration at a traffic light. VZone International configures thresholds during the deployment assessment using UAE-specific vehicle type and route norms ensuring that the scoring reflects actual risk rather than generating alert fatigue from events that are normal for the operating environment. Separate threshold profiles can be set for vehicle category, route type, and time of day. |
| 3 | Launch the Driver Coaching Programme The driving behavior data is only as valuable as the coaching programme that acts on it. Before the first scored trip, communicate clearly to drivers: what is being measured and why (safety and efficiency, not surveillance for disciplinary purposes); how scores are calculated and what the target score is; how often coaching conversations will occur and what format they will take; and what positive recognition is available for strong performance. Fleet operators who launch driving behavior tracking without advance driver communication generate resistance that reduces the programme’s effectiveness; those who frame it as a safety and professional development tool before deployment consistently achieve faster initial score improvement. |
| 4 | Review Weekly Scorecards and Coach Specifically The weekly scorecard review with each driver or with supervisors who then review with their driver teams should be specific rather than general. ‘Your score was 74 this week’ is a number without context. ‘You had 8 harsh braking events this week, 6 of which occurred on the Al Khail Road approach to the interchange let’s look at the GPS map for those events and discuss what was happening’ is a coaching conversation that addresses a specific pattern in a specific location with specific data. The GPS location context of each event enables this specificity; the coaching conversation that results from it produces behavior change because it addresses the driver’s actual situation rather than a generic safety reminder. |
| 5 | Incentivise Top Performers Recognition for top-performing drivers the highest safety scores, the largest week-on-week improvement, the longest streak without a harsh event maintains programme engagement beyond the initial improvement phase. Monthly driver safety awards, performance-linked bonuses, or public recognition in team meetings sustain the competitive motivation that leaderboards introduce but that requires ongoing reinforcement to remain effective. UAE fleet operators who combine the negative reinforcement of flagging risky drivers with positive reinforcement for safe drivers achieve more sustained score improvement than those who use either approach alone the most effective programmes make safety performance a positive career signal as well as a management monitoring tool. |
Driving Behavior Tracking and UAE Traffic Law Compliance
UAE Federal Traffic Law imposes specific penalties on commercial vehicle operators for speed-related and behavior-related violations that driving behavior tracking data can both prevent and document. Commercial vehicles caught exceeding speed limits by more than 40 km/h face fines of AED 3,000 and vehicle impoundment the GPS speed monitoring that driving behavior tracking provides creates an internal early-warning system that generates coaching action before a police-recorded violation occurs.
For ADNOC contractor fleets, IVMS driver behavior monitoring is a mandatory programme requirement driving behavior data in the ADNOC-specified format must be submitted for every trip on contractor vehicles accessing ADNOC facilities. A vehicle whose IVMS data submission shows a pattern of speed tier violations faces contractor programme findings that can affect site access authorisation. VZone International’s fleet management system generates ADNOC IVMS driver behaviour reports in the required format automatically weekly and monthly without requiring the fleet manager to extract and reformat data from the platform.
Driving behavior tracking data also creates a compliance evidence record that is increasingly relevant in UAE civil court proceedings following commercial vehicle accidents. A GPS behavior record showing that the fleet vehicle maintained appropriate speed, had no harsh events in the 60 seconds before the collision, and was operating within all configured thresholds is objective evidence of compliant driving conduct evidence that substantially strengthens the fleet operator’s position in at-fault determination proceedings where the third party’s account is the only alternative evidence.
Free AI Fleet Audit Get Your Fleet’s Driver Safety Score
VZone International’s free AI Fleet Audit generates a fleet-level driver safety baseline from your current vehicle and route data showing your projected driver safety score, the estimated incident frequency for your fleet profile, and the specific behaviors that driving behavior tracking would address first. See what your fleet’s safety score would be before committing to deployment. Contact our team to book your free audit.
Frequently Asked Questions
Driving behavior tracking in fleet management is the automated monitoring, recording, and scoring of driver conduct throughout every trip using GPS speed data and accelerometer measurements from the car GPS tracker system to detect speeding, harsh braking, rapid acceleration, sharp cornering, excessive idling, and seatbelt non-compliance. Each detected event is recorded with GPS location and timestamp, assigned a penalty in the driver's trip score, and aggregated into weekly safety scorecards that fleet managers use to identify high-risk drivers and conduct specific coaching conversations. AI dashcam integration adds distraction detection (phone use, eyes off road) and fatigue monitoring (eye closure, head drooping) to the event record extending behavior tracking from vehicle dynamics to driver physiological condition.
A car GPS tracker system detects harsh braking using the onboard three-axis accelerometer a sensor that measures the deceleration force experienced by the vehicle in the longitudinal (front-to-back) axis. When the measured deceleration exceeds a configured threshold typically 0.35g to 0.45g, equivalent to approximately 3.4 to 4.4 m/s² deceleration the system records a harsh braking event with the timestamp, GPS location, and the magnitude of the deceleration force. The threshold is configurable per vehicle type and route profile: a delivery van in urban traffic has a different appropriate threshold from a heavy truck on a highway, because the same g-force represents very different driving conditions in each context. Calibrated accelerometer mounting in the hardwired GPS device ensures that the measured force corresponds accurately to the actual vehicle dynamics at the threshold level.
Yes driving behavior tracking data is the primary evidence basis for telematics-based insurance premium reduction in UAE commercial vehicle fleet insurance. UAE commercial vehicle insurance carriers accept structured GPS behavior data driver safety scores, harsh event frequency by event type, accident-free period, and coaching programme documentation as evidence of reduced fleet risk relative to the actuarial average. Fleets that present comprehensive 12-month driving behavior tracking data packages at renewal typically achieve 10 to 20 percent premium reduction at first renewal, with additional reduction at subsequent renewals as coaching-driven accident frequency reduction improves the claims history. VZone International generates the insurance telematics data package in the format UAE insurers require automatically, from the platform's data archive without requiring the fleet manager to extract and format data manually.
The best driver scoring in a fleet management system for UAE operations is one that is calibrated for UAE road conditions, vehicle types, and route profiles rather than applying generic global thresholds. VZone International's AI driver scoring is trained on 300M+ km of UAE and GCC driving data calibrating harsh event thresholds, speeding detection, and idle time scoring against the actual driving patterns of UAE commercial vehicles on UAE roads, in UAE summer conditions, with UAE-specific speed limit enforcement patterns. This regional calibration means the score accurately reflects UAE-specific risk rather than penalising behaviors that are operationally normal in UAE conditions while missing the behaviors that are genuinely risky on UAE roads specifically.
In UAE commercial fleet operations, yes drivers should be informed that vehicle GPS tracking and driving behavior monitoring is active. UAE employment law requires that employees are informed when they are subject to workplace monitoring, and fleet GPS policy should be documented in employment contracts or fleet policy agreements before deployment. Informing drivers of behavior tracking is also operationally advantageous: the deterrent effect of known monitoring produces faster behavior change than surveillance alone, and drivers who understand the scoring methodology and coaching purpose engage more constructively with the programme than those who discover monitoring after the fact. VZone International provides driver communication materials in Arabic and English as part of the fleet deployment onboarding process.
Driving behavior tracking accuracy depends on the combination of GPS position accuracy and accelerometer calibration quality. GPS speed measurement accuracy for modern multi-constellation GNSS devices is within 0.5 km/h under clear sky conditions sufficient for meaningful speed event detection on UAE roads. Accelerometer-based event detection accuracy depends on the device's calibration and mounting rigidity: a well-calibrated, securely mounted accelerometer in a hardwired GPS device detects genuine harsh events with greater than 95 percent accuracy and generates fewer than 5 percent false positives in standard operating conditions. Consumer-grade OBD-II plug-in devices with uncalibrated accelerometers mounted at variable OBD port angles produce higher false positive rates penalising drivers for road surface vibrations or speed bump crossings that the scoring algorithm cannot distinguish from genuine harsh events. VZone International uses factory-calibrated Teltonika devices with fixed hardwired mounting as standard for UAE fleet behavior tracking deployments.