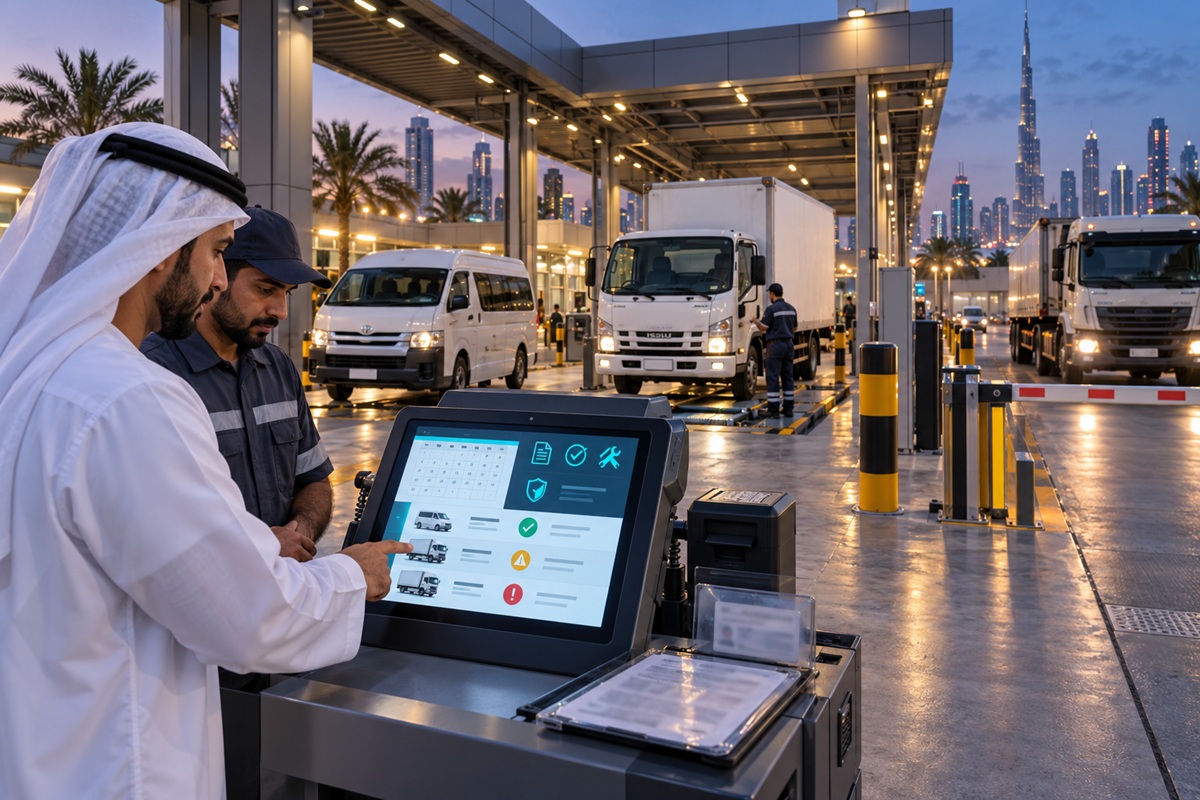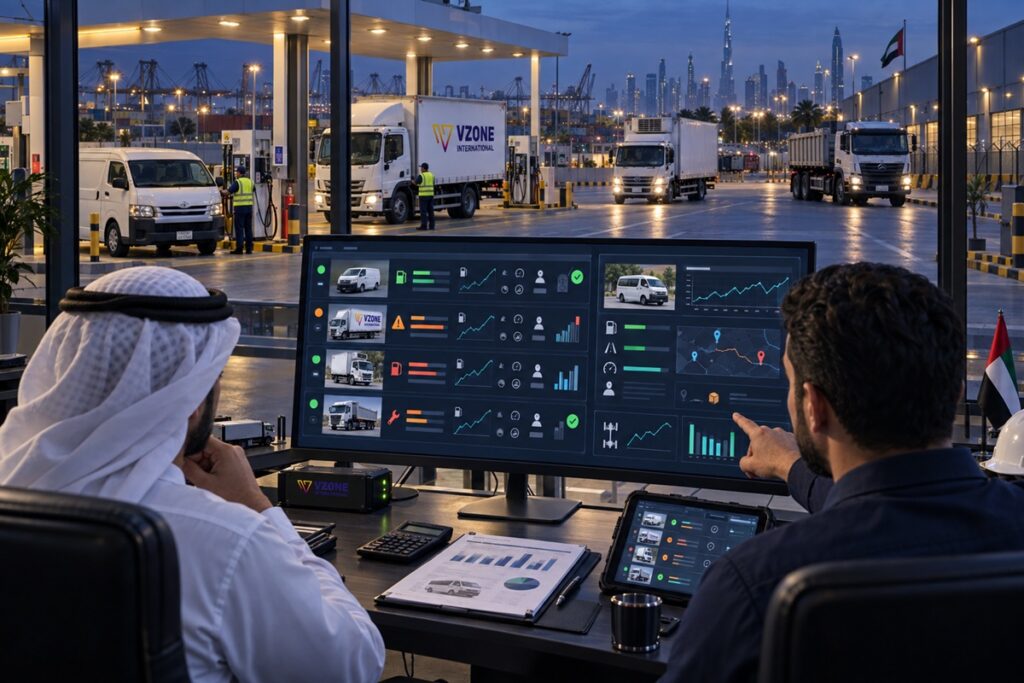
A fuel cost report that shows only the fleet’s total monthly fuel spend tells a fleet manager approximately the same thing as a bank statement that shows only the total account balance it confirms that money was spent without explaining where, why, or which specific items represent waste that can be eliminated. A fuel cost per vehicle report that breaks total spend into individual vehicle contributions, calculates consumption efficiency per vehicle and per driver, and flags the specific outliers that are driving the fleet’s above-budget performance is a management tool rather than a financial record.
Building a useful fuel cost per vehicle report requires deciding which metrics matter most for UAE fleet management (cost per kilometre, not just cost per month), which data sources are needed to calculate them accurately (GPS-verified distance, not driver-reported odometer), and how the report should be structured to drive action rather than simply inform. This guide explains the structure of an effective fleet fuel cost report, the calculations behind each metric, the UAE-specific adjustments that make the report accurate for local conditions, and how fleet management software automates the production of a report that would take 4 to 8 hours to produce manually.
Key Takeaways
- The most actionable fuel cost metric is cost per kilometre (AED/km) rather than total monthly spend cost per kilometre normalises for different annual mileage between vehicles and enables meaningful comparison between vehicles with very different operating profiles.
- A useful fleet fuel cost report has four sections: executive summary (fleet totals and budget position), per-vehicle ranking table (all vehicles sorted by fuel cost per km, highest to lowest), driver efficiency table (consumption per 100 km normalised for route type), and exceptions section (significant month-on-month increases, card reconciliation failures, high idling cost vehicles).
- UAE-specific adjustments are required for accurate fuel cost reporting: summer vs winter consumption baselines differ by 10 to 15 percent from A/C load; GPS-verified distance rather than driver-reported odometer; and Salik toll cost separation from fuel cost in the per-vehicle operating cost calculation.
- Fleet management software generates fuel cost per vehicle reports automatically from GPS and fuel card data eliminating the 4 to 8 hour monthly manual extraction, calculation, and formatting exercise that fleet managers currently perform with partial data.
- The report’s primary purpose is to drive action: the per-vehicle ranking identifies which vehicles to investigate; the driver efficiency table identifies which drivers to coach; the exceptions section identifies which events to follow up on before the next monthly review.
The Five Core Metrics in a Fuel Cost Per Vehicle Report
| Metric | Definition | Calculation | Data Required | Why It Matters |
| Total fuel spend (AED) | Total AED spent on fuel for the vehicle in the reporting period | Sum of all fuel card transactions + depot dispensing records attributed to the vehicle | Fuel card statement per vehicle + depot dispensing log | The absolute cost figure for budget tracking and cost allocation |
| Total kilometres driven | Total verified distance the vehicle covered in the period | GPS-verified odometer from fleet tracking platform | GPS telematics not driver-reported odometer | The denominator for all per-km calculations; accuracy is essential |
| Fuel consumption (L/100km) | Litres consumed per 100 km of distance driven | (Total litres consumed / total km driven) × 100 | Total litres from fuel sensor or card volume data + GPS distance | Primary efficiency metric; enables comparison across vehicles with different mileage |
| Fuel cost per kilometre (AED/km) | AED spent on fuel per km driven the primary comparison metric | Total fuel spend (AED) / total km driven | Fuel card AED total + GPS distance | Normalised for mileage variation; directly comparable between vehicles and against category benchmark |
| Variance from baseline (%) | How much the vehicle’s cost per km deviates from its own established baseline or category benchmark | ((Actual CPK – Baseline CPK) / Baseline CPK) × 100 | Vehicle’s own historical CPK from fleet platform; or category benchmark | Identifies which vehicles are performing above or below their expected efficiency |
Report Structure: Four Sections That Drive Action
Section A Executive Summary
The executive summary provides the fleet-level view that senior management and finance teams need in two minutes: total fleet fuel spend in the period (AED), comparison against budget (AED variance and percentage), comparison against prior period (month-on-month change), fleet-average fuel consumption (L/100km), and the number of vehicles above baseline (the count that indicates how widespread inefficiency is). The executive summary should fit on one page or one screen view if it requires scrolling or page-turning to see all five figures, it is too detailed for its purpose. The detail supporting each summary figure is in the sections below.
For UAE fleet operators who report to finance committees or board-level management, the executive summary is the only section of the fuel cost report that senior stakeholders read. It should answer: did we spend more or less than budgeted, by how much, and is the situation improving or deteriorating? The supporting sections explain why but the executive summary must answer the financial question first.
Section B Per-Vehicle Ranking Table
The per-vehicle ranking table lists every vehicle in the fleet sorted by fuel cost per kilometre from highest to lowest putting the most expensive vehicles at the top of the table for immediate visibility. For each vehicle, the table shows: vehicle registration, vehicle type/category, assigned driver (where applicable), total kilometres, total spend (AED), consumption per 100 km, cost per kilometre, and percentage variance from the vehicle’s baseline. The ranking table is the section that fleet managers use to identify which vehicles warrant investigation those significantly above category benchmark or significantly above their own historical baseline.
Vehicles in the top quartile by cost per kilometre should be reviewed individually: is the high cost from a route change (genuinely more demanding route), a vehicle condition issue (developing maintenance fault increasing consumption), driver behaviour (aggressive driving on this vehicle), or a data anomaly (incorrect fuel attribution from a card or sensor issue)? The ranking table identifies the vehicles; the GPS data explains the cause. Without the ranking table, the investigation has no starting point the fleet manager cannot identify which of 50 vehicles warrants attention without reviewing all 50.
Section C Driver Efficiency Table
The driver efficiency table shows fuel consumption per 100 km per driver, normalised for route type enabling fair comparison between drivers regardless of whether they operate primarily on urban routes (higher consumption from stop-start) or highway routes (lower consumption at efficient cruise speed). Route normalisation is essential for meaningful driver comparison: a driver achieving 12 L/100 km on urban Dubai delivery should be compared against the urban delivery benchmark (9 to 14 L/100 km) rather than against a driver achieving 8 L/100 km on Abu Dhabi highway routes. Without route normalisation, all urban drivers will consistently appear less efficient than all highway drivers generating coaching conversations based on misleading comparisons.
The driver efficiency table ranks drivers from least efficient to most efficient, with the bottom 20 percent highlighted for coaching focus. Each driver entry shows their consumption figure, their route-normalised comparison, their harsh event frequency (linked to consumption), and their idling duration for the period. The combination of consumption data and behaviour data in the same row enables the coaching conversation to be specific: ‘Driver Ahmed, your consumption this month was 13.8 L/100 km against your urban route benchmark of 11.5 L/100 km. Looking at your GPS data, you had 18 harsh acceleration events and 85 minutes of idling above the policy threshold those two behaviours explain your above-baseline consumption.’
Section D Exceptions and Alerts Summary
The exceptions section captures the specific events that the automated monitoring system flagged during the reporting period fuel card reconciliation exceptions (transactions where vehicle GPS location did not match the card purchase location), siphoning alerts (rapid fuel level drops without ignition-on events), significant month-on-month cost increases for specific vehicles (above-baseline variance triggers), and idling cost highlights (vehicles in the top 10 for idling duration and cost). This section converts the automated alert history into a structured review list for the fleet manager each exception with its date, vehicle, type, and the follow-up action taken or required.
The exceptions section is the action accountability record: it shows not just what happened (the alert) but what was done about it (the follow-up). A fuel card reconciliation exception that was investigated and found to be driver card misuse should show: exception date, vehicle, transaction details, investigation outcome, action taken (driver coaching, formal warning, or termination as appropriate under UAE labour law), and resolution date. This accountability record protects the fleet operator in any subsequent HR or legal process related to the exception.
UAE-Specific Adjustments for Accurate Fuel Reporting
Summer vs Winter Consumption Baseline Adjustment
UAE fleet fuel consumption is not uniform across the calendar year summer months (June through September) consistently produce higher fuel consumption per kilometre than winter months (October through April) for the same vehicles on the same routes, due to the increased A/C load in extreme heat. The difference is 10 to 15 percent for light commercial vehicles; heavy trucks with more powerful A/C systems and higher base consumption show a smaller percentage increase. A fuel cost report that compares June consumption against a baseline calculated from October to April data will systematically show above-baseline consumption for all vehicles in summer not because the fleet is being managed poorly but because the baseline is wrong for the season.
UAE-accurate fuel cost reporting uses separate summer and winter baselines for each vehicle category the summer baseline includes the expected A/C load addition; the winter baseline does not. Month-on-month comparison should note when the comparison crosses the seasonal boundary: a May-to-June increase is expected and partially seasonal; a June-to-July increase above the seasonal expectation warrants investigation; a July-to-August increase above the prior July is genuinely concerning.
GPS-Verified Distance Not Odometer
The denominator in every per-kilometre fuel metric is distance driven. The accuracy of cost-per-kilometre, consumption-per-100-km, and all other distance-normalised metrics depends entirely on the distance figure being accurate. Driver-reported odometer readings in UAE commercial fleets are systematically understated drivers who are aware that odometer reading is used for service scheduling consistently report lower mileage to defer service appointments. An odometer-based fuel cost report will systematically overstate fuel efficiency (lower reported distance → lower apparent consumption per km → better-looking cost per km) for vehicles whose drivers understate mileage.
GPS-verified distance from the fleet tracking platform eliminates this distortion the GPS odometer cannot be manipulated by the driver. A vehicle that actually drove 4,200 km in October shows 4,200 km in the GPS odometer regardless of what the driver submitted. For UAE fuel cost reporting, GPS-verified distance is not an improvement over driver-reported odometer it is a requirement for accuracy. Reports built on driver-reported distance are unreliable as management tools because the baseline data is manipulated.
Salik and Toll Separation
UAE fleet operating cost reports often combine Salik toll charges with fuel card transactions in a single ‘motoring cost’ line particularly for fleets using integrated Salik + fuel card payment products. For fuel cost reporting purposes, Salik and fuel costs should be separated: Salik toll is a fixed-per-crossing cost determined by route selection, not by vehicle efficiency or driver behaviour; fuel is a variable cost influenced by both. Combining them in a single per-vehicle figure confounds route management decisions (which routes use fewer Salik gates) with fuel efficiency management decisions (which vehicles and drivers use fuel most efficiently). VZone International’s fleet platform separates Salik transaction costs from fuel card costs in the per-vehicle operating cost calculation, enabling separate reporting and analysis of each cost component.
Building the Report: Manual vs Automated
| Report Element | Manual Production Method | Time Required (Manual) | Automated Production Method | Time Required (Automated) |
| Fleet-level fuel spend total | Sum fuel card statements for all vehicles; reconcile ENOC + ADNOC + any cash | 45-60 min | Automatic from card API integration; pre-aggregated in platform | 0 min always current |
| Per-vehicle GPS distance | Export GPS distance report from fleet platform; match to vehicle list | 20-30 min | Automatic from GPS telematics; per-vehicle in platform | 0 min |
| Consumption per 100 km per vehicle | Divide card volume by GPS distance per vehicle in spreadsheet | 30-45 min | Calculated automatically from card volume + GPS distance | 0 min |
| Cost per km per vehicle | Divide card AED total by GPS distance per vehicle in spreadsheet | 15-20 min | Calculated automatically; ranked table generated on request | 0 min |
| Driver efficiency table (route-normalised) | Requires route classification per trip practically impossible manually | Not feasible without automation | Route normalisation applied automatically from GPS route data | 0 min |
| Exceptions and alerts | Review alert log manually; cross-reference with investigation notes | 30-60 min depending on alert volume | Exception report generated automatically from alert history | 0 min |
| Summer/winter baseline adjustment | Requires seasonal baseline stored separately and applied to each vehicle | 15-30 min if baselines exist | Seasonal baseline applied automatically; platform stores per-vehicle seasonal baseline | 0 min |
| TOTAL | 3-4 hours minimum | 20-30 min review of auto-generated report |
Fuel Cost Report Distribution and Action Process
A fuel cost report that is produced and filed without driving specific management actions is a cost reporting exercise rather than a fuel management tool. The distribution and action process determines whether the report produces the behaviour changes and investigation actions that generate fuel cost reduction.
Weekly vs Monthly Reporting Cadence
Monthly fuel cost reports are the financial record of what happened in the prior 30 days by the time the report is reviewed, a driver who has been over-consuming for the entire month has already generated the waste that the report documents. Weekly fuel efficiency reports focused on the driver efficiency table and exceptions section rather than the full financial detail enable coaching conversations while the behaviour is current and while the saving from correction accrues through the remaining weeks of the month. The recommendation for UAE fleet operators is: monthly full fuel cost report for financial management and budget tracking; weekly driver efficiency and exceptions summary for operational management and coaching.
Report Distribution by Role
Fuel cost per vehicle reports should be distributed differently to different management roles. Finance director and CFO: executive summary only total spend, budget variance, trend. Fleet manager: full report all four sections, all vehicle details. Depot supervisors: per-depot section only the vehicles in their depot, not the full fleet. Drivers: own consumption data only their own fuel efficiency score and comparison to fleet average, via the driver app, not a PDF report. The driver-facing fuel efficiency score visible to the driver through the driver app is the most operationally useful version of fuel reporting for the driver coaching programme, because it is immediate (updated after each trip), personal (the driver’s own data), and actionable (linked to specific GPS events that explain the score).
VZone International Fleet Fuel Cost Reports Automatic, Per-Vehicle, Per-Driver, UAE-Calibrated
VZone International’s fleet management platform generates fuel cost per vehicle reports automatically from GPS telematics and fuel card integration covering total spend, cost per kilometre, driver efficiency (route-normalised), exceptions, and budget variance. Reports are scheduled for automatic delivery to fleet managers, finance teams, and depot supervisors. Summer/winter baseline adjustment, GPS-verified distance, and Salik separation are all built into the reporting configuration. Contact our team to configure automated fuel reporting for your UAE fleet.
Frequently Asked Questions
A fleet fuel cost report should include four sections. Executive summary: total fleet fuel spend (AED), budget variance, month-on-month comparison, and fleet-average consumption per 100 km. Per-vehicle ranking table: all vehicles listed by fuel cost per kilometre from highest to lowest, with total spend, total kilometres, consumption per 100 km, cost per km, and variance from baseline for each vehicle. Driver efficiency table: all drivers ranked by consumption per 100 km normalised for route type, with harsh event frequency and idling duration per driver. Exceptions section: fuel card reconciliation exceptions (GPS location mismatches), siphoning alerts, significant month-on-month cost increases, and idling cost highlights. Together these four sections identify where the fleet's fuel money went, which vehicles and drivers are responsible for above-baseline spend, and what specific events require follow-up investigation or coaching.
UAE commercial fleets should produce fuel cost reports on two cadences serving different purposes. Monthly full fuel cost reports serve financial management: total fleet spend vs budget, per-vehicle cost ranking, and exceptions history all four sections, distributed to fleet manager and finance team. Weekly driver efficiency summaries serve operational management: driver efficiency ranking, idling highlights, and open exceptions requiring follow-up a shorter operational report focused on coaching and exception management rather than financial reconciliation. Fleet management software generates both automatically from the same underlying data, so producing weekly and monthly reports does not require additional data collection the report cadence is a configuration choice rather than an additional workload.
Fuel consumption per vehicle in UAE fleets is calculated by dividing the total volume of fuel consumed by the vehicle in the reporting period by the total kilometres driven in the same period, multiplied by 100 to express as litres per 100 km. Total fuel volume comes from either vehicle fuel sensor data (the most accurate source, recording every fill event and calculating consumption from fill-to-fill level changes) or from fuel card transaction volumes attributed to the vehicle (less accurate does not account for timing differences between fills and consumption, or for any depot dispensing that bypasses the card). Total kilometres come from GPS-verified odometer data from the fleet tracking platform not from driver-reported readings, which are systematically understated in unmanaged UAE fleets. The resulting figure (L/100 km) is then compared against the vehicle's established seasonal baseline (summer or winter) and the UAE category benchmark for the vehicle type to identify whether the vehicle is performing within expected parameters or is a consumption outlier.
Yes VZone International's Wialon fleet management platform generates fuel cost per vehicle reports automatically from GPS telematics data and fuel card API integration. The platform calculates cost per kilometre, consumption per 100 km, variance from baseline, driver efficiency scores (route-normalised), and idling cost per vehicle from the integrated data sources without any manual calculation. Reports are available on the dashboard in real time and can be scheduled for automatic email delivery to configured recipients fleet manager, finance team, or depot supervisors at any configured frequency (daily, weekly, or monthly). The fleet manager reviews the auto-generated report and takes action on exceptions rather than assembling the report data manually. For UAE fleets with ERP integration (SAP, Oracle, Odoo, Zoho), the fuel cost data is also automatically posted to the ERP for financial reporting without manual extraction and import.