Most UAE fleet managers are managing by exception reacting to incidents, complaints, and cost overruns after they have already happened, because the data that would have predicted them either does not exist or is buried in reports that take days to produce. A driver who has been generating harsh braking events every shift for two weeks does not show up in the monthly summary until the summary is compiled. A vehicle that missed its service interval three weeks ago does not generate an alert until someone checks the maintenance log. A fuel anomaly that has been accumulating across three vehicles for a fortnight becomes visible only when the monthly expense report arrives.
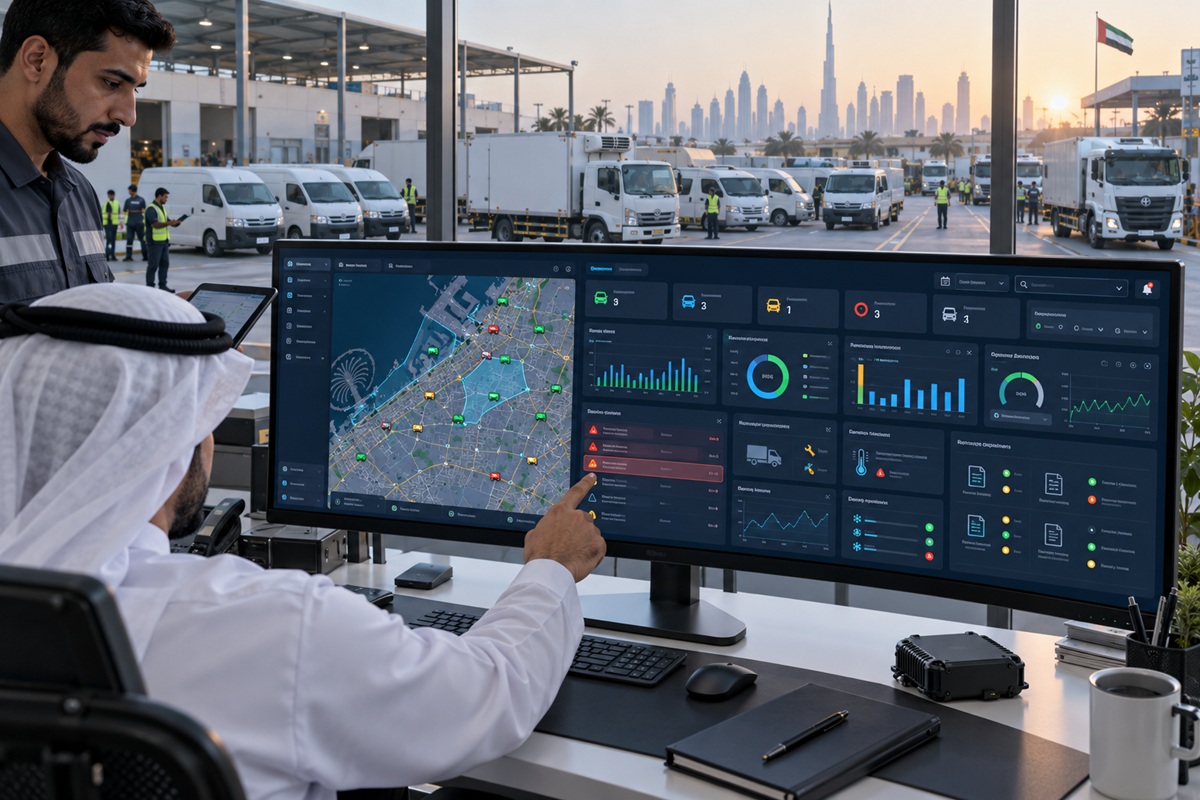
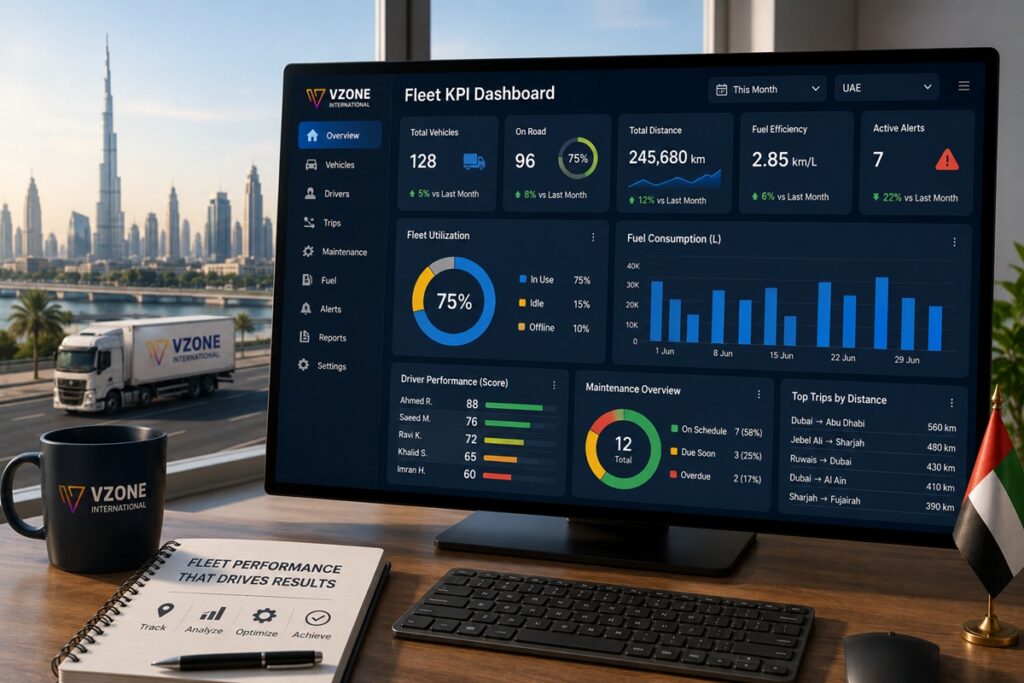
A well-configured fleet KPI dashboard changes this entirely. Instead of managing by exception from monthly reports, fleet managers manage in real time from a single screen that shows the current state of every critical metric across the fleet updated continuously as telematics data arrives. The decision to coach a driver happens on Tuesday morning when the dashboard shows their safety score has dropped to 62, not at the monthly review meeting when the pattern has already cost the company two near-miss incidents.
This guide explains what a fleet KPI dashboard should contain for UAE fleet operations, how to structure the five metric categories that matter, what specific metrics to track within each category, and how a modern fleet management platform populates all of them automatically without requiring a dedicated analyst to compile reports.
Key Takeaways
- An effective UAE fleet KPI dashboard tracks five metric categories simultaneously: financial performance, operational efficiency, driver safety, regulatory compliance, and vehicle maintenance each with specific metrics appropriate for the UAE operating context.
- Cost per kilometre not total fleet spend is the most useful financial metric for UAE fleet managers because it normalises across fleet size, vehicle mix, and route profile, making it comparable between time periods and across different vehicle categories.
- Driver safety scores are the leading indicator of accident risk: fleets that identify and coach drivers with declining safety scores prevent incidents before they occur, rather than investigating causes after they happen.
- UAE compliance metrics Asateel data submission status, IVMS driver behaviour event rates, vehicle documentation currency must appear on the fleet dashboard alongside operational metrics, not in a separate compliance management system.
- A fleet management platform that populates KPI dashboards automatically from live telematics data eliminates the analyst overhead of manual report compilation the fleet manager sees current metrics without waiting for a weekly or monthly report cycle.
- Role-based dashboard access different views for fleet managers, operations managers, safety managers, and senior leadership ensures each stakeholder sees the metrics relevant to their decisions without information overload.
Why Most UAE Fleet Dashboards Fail
The majority of fleet dashboards that fleet managers in UAE actually use are not dashboards at all they are report repositories. A collection of Excel exports, PDF summaries, portal screenshots, and WhatsApp messages from drivers, assembled into a shared folder that someone checks when they need information. This is not a dashboard; it is an archive of historical data that was relevant when it was collected and is increasingly stale by the time it is reviewed.
The second most common failure is the dashboard that tracks everything. A screen with 40 metrics across vehicle counts, driver counts, trip counts, alert counts, mileage totals, fuel totals, incident counts, and maintenance items is not a management tool it is a data dump. Fleet managers who open a screen and scan 40 numbers are not managing from the dashboard; they are using the dashboard as a search interface to find the number that explains the problem they are already aware of.
An effective fleet KPI dashboard is the opposite of both failures. It is updated continuously from live data, not periodically from reports. It tracks the 15 to 20 metrics that determine fleet performance, not every metric the platform can produce. And it is structured to surface the metrics that need management attention deviations from targets, declining trends, compliance gaps rather than displaying everything and requiring the manager to find the signal in the noise.
The Five KPI Categories Every UAE Fleet Dashboard Needs
Category 1 Financial Performance
Financial KPIs answer the question every fleet owner and operations director asks first: what is this fleet costing, and is that cost increasing or decreasing? The right financial metrics are normalised not absolute spend totals that fluctuate with fleet size and activity levels, but per-unit costs that are comparable across time periods and between vehicle categories.
| KPI | Definition | UAE Benchmark | Dashboard Frequency |
| Cost per kilometre (CPK) | Total fleet operating cost divided by total kilometres driven | AED 0.55–0.95 depending on vehicle type | Monthly trend + rolling 3-month average |
| Fuel cost per kilometre | Total fuel spend divided by total kilometres driven | AED 0.18–0.35 (petrol/diesel, vehicle-dependent) | Weekly most volatile cost element |
| Maintenance cost per vehicle per month | Total maintenance spend divided by active vehicle count | AED 800–2,500 depending on vehicle age/type | Monthly |
| Fleet utilisation rate (%) | Hours vehicles were in active use vs available hours | Target: 70–85% for commercial fleets | Daily operational view |
| Cost per delivery / service visit | Total fleet cost allocated per completed delivery or service stop | Varies by operation type | Weekly for logistics fleets |
Category 2 Operational Efficiency
Operational KPIs measure whether the fleet is achieving its core purpose deliveries made, routes completed, service calls resolved at the efficiency level that the business model requires. These are the metrics that operations managers check daily and that fleet managers use to identify where vehicle, route, or process changes will deliver the most operational improvement.
| KPI | Definition | Target / Benchmark UAE | Dashboard Frequency |
| On-time delivery rate (%) | Deliveries completed within committed time window | Target: >92% for UAE commercial logistics | Daily immediate customer SLA signal |
| Stops per driver per day | Average completed delivery or service stops per driver shift | Industry benchmark: 14–22 depending on stop type | Daily route performance view |
| Average route completion time | Actual route time vs planned route time | Target: within 10% of planned | Daily by route and driver |
| Fleet kilometre efficiency | Actual km driven vs optimal route distance for same stops | Target: within 15% of optimised route distance | Weekly |
| Vehicle idle time (hours/day) | Engine-on time with zero movement per vehicle | UAE target: <0.5 hours/day (A/C load factored) | Daily high summer A/C cost driver |
| First-attempt delivery rate (%) | Deliveries completed on first attempt without redelivery | Target: >94% for UAE urban delivery | Weekly |
Category 3 Driver Safety
Safety KPIs are the most directly consequential metrics on the fleet dashboard because they are leading indicators they predict incidents before they occur rather than lagging indicators that measure damage after it has happened. A fleet manager who monitors driver safety scores weekly and coaches drivers whose scores are declining prevents the incident that a manager who monitors only accident rates will discover only in the next monthly report.
| KPI | Definition | Target for UAE Commercial Fleets | Dashboard Frequency |
| Driver safety score (0–100) | Composite score from harsh braking, acceleration, cornering, speeding, phone use events | Target: fleet average >80; individual alert at <65 | Daily individual + weekly fleet trend |
| Harsh event rate (per 100 km) | Total harsh driving events divided by total kilometres driven | Target: <4.0 events per 100 km | Weekly by driver and vehicle |
| Speeding event rate | Trips with at least one speed threshold exceedance divided by total trips | Target: <5% of trips | Weekly driver coaching input |
| Seatbelt compliance rate (%) | Trips where seatbelt sensor shows compliant status throughout | Target: >98% IVMS mandatory data point | Weekly IVMS compliance report |
| Near-miss and incident rate | Reported near-miss or minor incidents per 10,000 km | Target: <1.5 per 10,000 km | Monthly trend |
| Fatigue event rate (AI dashcam) | Driver fatigue or distraction events detected per 1,000 km | Target: <2.0 per 1,000 km | Daily for long-haul routes |
Category 4 Regulatory Compliance
UAE fleet compliance KPIs are unique to the region’s regulatory landscape and must appear on the fleet dashboard alongside operational and financial metrics not in a separate compliance portal that the fleet manager checks only when an audit is approaching. Asateel data submission gaps, expired vehicle documents, and IVMS event rate anomalies are compliance risks that accumulate daily and can only be managed proactively if they are visible daily.
| KPI | Definition | Alert Threshold | Dashboard Frequency |
| Asateel data submission status | % of registered vehicles with active, continuous GPS data transmission to ITC portal | Alert: any vehicle offline >30 minutes | Real-time compliance-critical |
| IVMS driver behaviour event rate | Weighted IVMS event score per driver per period (speed tiers, harsh events) | Alert: any driver exceeding ADNOC threshold | Weekly HSE report input |
| Vehicle document expiry (Mulkia/insurance) | Count of vehicles within 30/14/7 days of Mulkia or insurance renewal | Alert: 30 days before expiry | Daily document management view |
| Fahas inspection overdue | Count of vehicles past periodic inspection due date | Alert: any vehicle overdue | Daily |
| Driver licence expiry | Count of drivers within 30/14/7 days of licence renewal | Alert: 30 days before expiry | Weekly |
| SecurePath offline rate (Dubai rental) | % of Dubai-registered rental vehicles with active SecurePath transmission | Alert: any vehicle offline >15 minutes | Real-time for rental fleets |
Category 5 Vehicle Maintenance
Maintenance KPIs track the health and serviceability of the physical fleet the asset base that all operational performance depends on. The most commercially significant maintenance KPI is unplanned downtime: the vehicle that breaks down mid-route creates not just repair cost but operational disruption, delayed deliveries, and driver overtime that collectively cost three to five times the repair cost itself. Predictive maintenance metrics that identify vehicles approaching failure before the failure occurs engine diagnostic trend alerts, service overdue counts, cumulative fault code frequency are the fleet manager’s most powerful tool for preventing downtime from becoming operational disruption.
| KPI | Definition | Target for UAE Fleets | Dashboard Frequency |
| Unplanned vehicle downtime rate (%) | Hours vehicle is unavailable due to unplanned breakdown vs total available hours | Target: <3% for well-maintained UAE commercial fleet | Weekly maintenance programme health indicator |
| Planned vs unplanned maintenance ratio | Planned (preventive) maintenance events vs unplanned (breakdown) events | Target: >80% planned maintenance ratio | Monthly maintenance management view |
| Service overdue count | Vehicles past scheduled service interval (mileage or calendar) | Alert: any vehicle overdue | Daily |
| Mean time between failures (MTBF) | Average operational time between breakdown events per vehicle | Benchmark varies by vehicle type and age | Monthly fleet health trend |
| Tyre pressure compliance rate (%) | % of vehicles with all tyres within specification (TPMS monitoring) | Target: >97% at departure check | Daily UAE summer blowout risk |
| Open fault code count | Vehicles with active OBD-II engine fault codes unresolved | Alert: any P-code (serious) fault unresolved >48 hrs | Daily maintenance queue |
How to Structure Your Fleet Dashboard Four Views
A single screen attempting to show all 20+ KPIs simultaneously is not a dashboard it is a report. Effective fleet dashboards use role-based views that present each stakeholder with the metrics relevant to their decisions, at the time granularity they need for their decision cycle.
The Operations Manager View Real-Time Daily
The operations manager’s view is the highest-frequency view checked multiple times per day to manage active fleet operations. It shows: all vehicles currently on-route on a live map with route progress and estimated completion times; active alerts (temperature excursions, route deviations, harsh event alerts, geofence breaches); today’s delivery performance (stops completed vs planned, on-time rate for the day so far); and any vehicles that have gone offline from Asateel or SecurePath data submission. This view is action-oriented: every metric on it either confirms things are running normally or identifies something that requires immediate dispatcher or supervisor intervention.
The Fleet Manager View Weekly Performance
The fleet manager’s view aggregates the weekly performance trends that determine whether the fleet is improving, stable, or declining across all five KPI categories. Driver safety score distribution across the fleet with the drivers whose scores have declined more than 10 points week-over-week flagged for attention. Fleet cost per kilometre trend. Utilisation rate by vehicle category. Service overdue count. Document expiry upcoming in the next 30 days. This view drives the fleet manager’s weekly decisions: which drivers to coach, which vehicles to schedule for maintenance, which cost trends to investigate, which compliance renewals to action.
The Safety Manager View Compliance and Incident
The safety manager’s view focuses on driver behaviour trends, IVMS compliance data, and incident pipeline. Weekly IVMS driver behaviour event rates with individual driver performance rankings. Seatbelt compliance rates. Fatigue event rates from AI dashcam data. Open near-miss or incident investigations. Compliance training completion rates. This view feeds the safety manager’s coaching programme, the weekly HSE report for ADNOC clients, and the management review evidence that both regulatory auditors and insurance underwriters examine.
The Leadership View Monthly Summary
Senior management and board-level fleet reporting requires a different information architecture from the operational views. Leadership needs to see fleet performance against business targets not daily operational metrics but monthly trends in the KPIs that affect business outcomes: total fleet cost as a percentage of revenue, cost per delivery trend against budget, safety incident rate trend against industry benchmark, compliance programme status. This is the view that answers ‘is our fleet a competitive cost advantage or a cost liability?’ and ‘what is the financial return on our fleet technology investment?’
Building Your Dashboard on a Fleet Management Platform
The practical challenge of building an effective fleet KPI dashboard is data integration pulling all five KPI categories from a single, coherent data source rather than assembling metrics from separate systems for GPS, fuel, maintenance, and compliance. A fleet management platform that provides all data streams on a single platform enables the unified dashboard; separate systems for GPS, fuel monitoring, maintenance scheduling, and compliance management require either manual aggregation (an analyst’s weekly task) or expensive bespoke integration.
What a Platform Dashboard Auto-Populates
A modern fleet management platform built on enterprise telematics infrastructure populates the operational, safety, and compliance KPI categories automatically from live telematics data no manual input required. GPS data provides location, route progress, idle time, and utilisation metrics. Accelerometer and CAN bus data provides driver behaviour event data for safety scores. Asateel and SecurePath data submission status is monitored automatically with offline alerts. IVMS event rates are calculated and formatted for HSE report generation without analyst intervention.
The financial KPI categories require one additional data input layer: cost integration. Fuel card transaction data, vehicle insurance and maintenance invoice data, and driver cost allocation data must be connected to the platform either through direct integration (many enterprise fleet platforms offer fuel card API connections) or through periodic import. Once the cost data flows into the platform, the financial metrics cost per kilometre, fuel cost per kilometre, maintenance cost per vehicle are calculated automatically alongside the operational and safety metrics.
VZone International’s Fleet Analytics Dashboard
VZone International’s Wialon and FMSiTrack platform provides configurable KPI dashboards across all five metric categories populated automatically from live telematics data for operational, safety, and compliance metrics, with fuel card and maintenance cost integration for financial metrics. Role-based views are configurable for operations managers, fleet managers, safety managers, and senior leadership, with each view presenting the relevant metrics at the appropriate time granularity.
The dashboard integrates with the VZone AI Fleet Assistant trained on 300M+ km of UAE and GCC driving data to provide benchmark comparisons against UAE fleet performance norms and AI-generated insights about metric trends. A driver safety score that has declined for three consecutive weeks generates an automatic coaching recommendation alongside the metric display, connecting the measurement directly to the management action without requiring the fleet manager to identify the pattern and determine the appropriate response independently.
For UAE fleet clients with ERP requirements, VZone’s API connectivity allows fleet KPI data to flow into SAP, Oracle, Odoo, and Zoho financial reporting environments enabling fleet performance metrics to appear in the same management reporting infrastructure as other business performance data, rather than in a separate fleet system that finance teams access through a separate login.
Conclusion: A Fleet Dashboard That Drives Decisions, Not Just Displays Data
The difference between a fleet dashboard that fleet managers actually use and one they check only when something goes wrong is not the number of metrics it displays it is whether those metrics are current enough to enable action before consequences materialise. A dashboard that tells a fleet manager their driver safety scores are declining on Tuesday morning creates a coaching conversation that prevents the incident. The same information in Friday’s weekly report arrives after the incident has already occurred.
Building an effective UAE fleet KPI dashboard requires three things: the right metrics across five categories (financial, operational, safety, compliance, maintenance), the right structure across four role-based views (operations, fleet manager, safety, leadership), and a fleet management platform that auto-populates all of them from live telematics data without requiring manual compilation. The last requirement is what determines whether the dashboard is actually used if it requires analyst time to produce, it gets produced less often than it should, and the management decisions it should be driving happen on a cycle that is too slow for the operational context.
VZone International’s fleet management platform provides the automated dashboard infrastructure that converts UAE fleet telematics data into the five KPI categories, four role-based views, and real-time update frequency that effective fleet management requires without the analyst overhead or data fragmentation that separate systems for GPS, fuel, maintenance, and compliance create.
See what your fleet KPI dashboard should look like in 30 minutes.
VZone International provides a live platform demo tailored to your fleet size, industry, and compliance requirements showing you exactly what each of the five KPI categories looks like in real time for your specific operation. Book a free dashboard demo today and see fleet management intelligence that actually drives decisions.
Frequently Asked Questions
A UAE fleet manager's dashboard should track five KPI categories: financial (cost per kilometre, fuel cost per km, maintenance cost per vehicle), operational (on-time delivery rate, fleet utilisation, stops per driver, idle time), safety (driver safety score, harsh event rate, speeding rate, seatbelt compliance), compliance (Asateel submission status, IVMS event rate, document expiry, Fahas overdue), and maintenance (unplanned downtime rate, planned vs unplanned maintenance ratio, service overdue count, open fault codes). These 20 metrics across five categories provide the complete performance picture that UAE fleet managers need for daily operational decisions and weekly management decisions.
Cost per kilometre (CPK) for UAE fleet management is the total operating cost of the fleet divided by the total kilometres driven over the same period expressed as AED per kilometre. It includes fuel, maintenance, insurance, depreciation, tyres, and driver costs. UAE benchmarks typically range from AED 0.55 to AED 0.95 per kilometre depending on vehicle type, age, and route profile with heavy trucks and older vehicles at the higher end and modern light commercial vehicles on optimised urban routes at the lower end. CPK is the most useful single financial metric for fleet managers because it normalises across fleet size changes and activity level variations.
Fleet utilisation rate is calculated as the percentage of available vehicle-hours that vehicles were in active operation. Active operation means engine-on and moving not stationary with engine running (idle) and not parked at depot. Available hours are the contracted operating hours for each vehicle. For example, a vehicle available for 10 hours per day that was actively moving for 7.5 hours has a 75 percent utilisation rate. UAE commercial fleet benchmarks target 70 to 85 percent utilisation for delivery fleets. Vehicles consistently below 60 percent utilisation are candidates for redeployment or fleet size reduction. GPS fleet management platforms calculate utilisation automatically from movement and ignition data without manual recording.
A driver safety score is a composite metric calculated from driver behaviour event data captured by vehicle telematics combining harsh braking events, aggressive acceleration events, harsh cornering events, speeding events, seatbelt compliance, and in AI dashcam-equipped fleets, distraction and fatigue events. Each event category is weighted by severity and frequency, and the combined score is expressed on a 0 to 100 scale. Scores above 85 indicate low-risk driving behaviour; scores below 65 indicate elevated accident risk and trigger coaching intervention. Driver safety scores are the most commercially valuable single metric in fleet safety management because they predict accident probability in advance, enabling preventive coaching rather than reactive incident investigation.
Building a fleet management dashboard without a dedicated analyst requires a fleet management platform that auto-populates metrics from live telematics data rather than from periodic manual report inputs. The platform should provide configurable dashboards with role-based views each stakeholder sees their relevant metrics without requiring an analyst to produce a customised report. Financial metrics require connecting fuel card and maintenance cost data to the platform, either through API integration (available in enterprise platforms) or periodic import. VZone International's Wialon and FMSiTrack platform auto-populates all five KPI categories from live data for UAE fleet clients, eliminating the analyst overhead that spreadsheet-based fleet reporting requires.