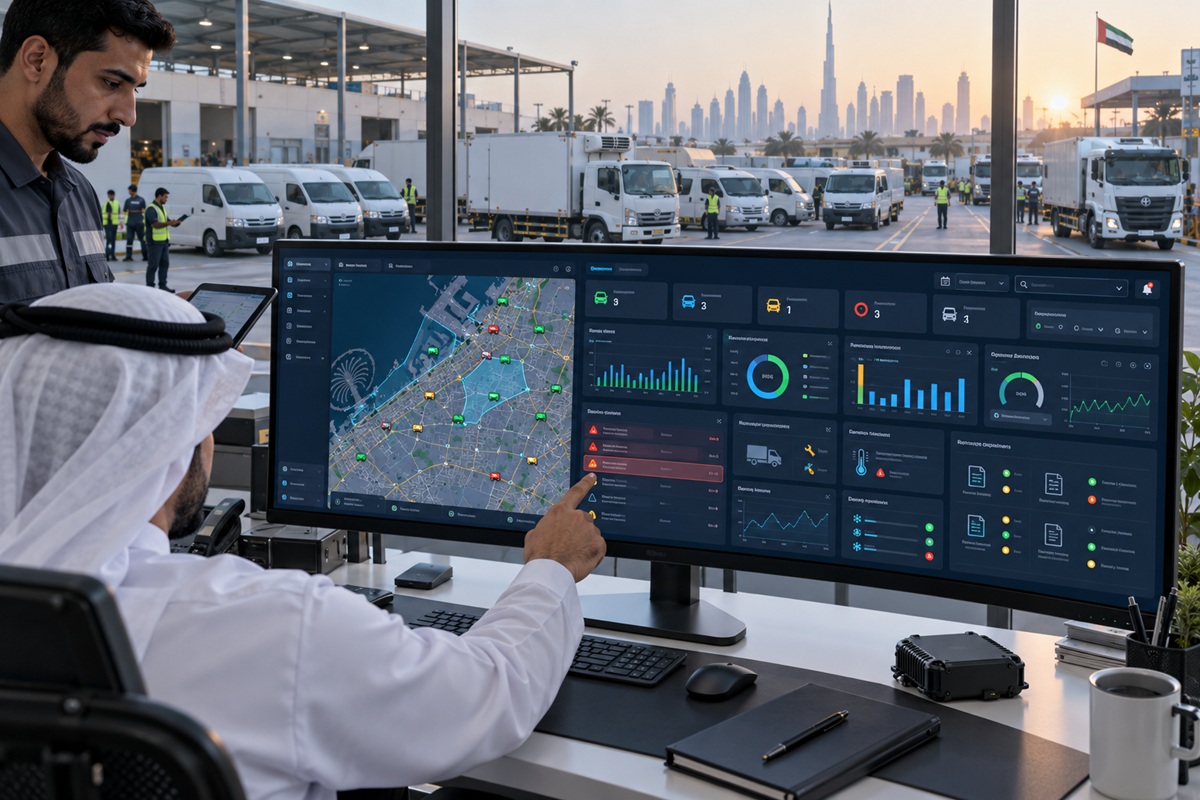
Fuel is the largest single operating cost for most UAE commercial fleet operators typically representing 30 to 40 percent of total vehicle operating cost, ahead of maintenance, depreciation, and insurance. For a 50-vehicle fleet covering 3 million kilometres annually at UAE commercial diesel rates, the fuel bill reaches AED 450,000 to AED 600,000 per year. A 25 percent reduction in that cost achievable within 12 months of deploying fleet fuel monitoring software saves AED 112,000 to AED 150,000. The investment in the software platform is recovered within the first 2 to 3 months of the saving, and the saving compounds annually.
The four drivers of fleet fuel waste are consistent across UAE commercial fleets, and each is measurable and addressable through telematics data. Idling engines running while vehicles are stationary consumes fuel with zero productive output and is the easiest waste to quantify and eliminate. Aggressive driving harsh acceleration, over-speed, and harsh braking increases fuel consumption by 20 to 35 percent above efficient driving baselines on the same routes. Fuel theft and card misuse siphoning, card sharing, or fuel purchases not associated with fleet vehicles is a consistent finding at first deployment in 8 to 15 percent of UAE fleets. Route inefficiency vehicles covering more kilometres than the optimal route requires is the fourth category, addressable through route optimisation that reduces total distance driven. This guide quantifies each waste source and explains how fleet fuel monitoring software addresses it.
Key Takeaways
- Fuel monitoring software for UAE fleets integrates GPS telematics data (idling time, speed profiles, route distance) with fuel sensor data or fuel card transaction records to provide per-vehicle, per-trip, and per-driver fuel consumption visibility enabling both real-time driver coaching and retrospective fleet-wide fuel analysis.
- Idling reduction is the fastest fuel saving to achieve: UAE urban fleets typically accumulate 45 to 90 minutes of daily idling per vehicle (A/C idling in parked vehicles, traffic queue idling, waiting for loading/unloading) at a fuel cost of AED 3 to AED 6 per idling hour for a light commercial van. Configuring idling alerts that fire after 5 minutes of continuous idling, combined with driver coaching, reduces idling by 60 to 70 percent within 30 days of alert activation.
- Eco-driving coaching from GPS telematics data targeting the 20 percent of drivers who generate 60 percent of fuel waste events produces the largest absolute fuel saving per unit of coaching time invested, because the behaviour change by high-consumption drivers produces a disproportionate reduction in fleet-average fuel consumption.
- Fuel sensor integration a calibrated fuel level sensor installed in the vehicle’s fuel tank provides real-time fuel level monitoring that detects siphoning (rapid fuel level drop without engine-on event), topping up (fuel level rise without a recorded fuel card transaction), and fuel consumption anomalies (consumption rate significantly above the vehicle’s baseline for the route type).
- Route optimisation that reduces total fleet distance by 10 percent produces a direct 10 percent reduction in fuel consumption with no behavioural change required pure mathematics applied to dispatch and routing decisions that most UAE fleets currently make manually.
Section 1 The Four Sources of Fleet Fuel Waste in UAE
| Waste Source | How It Occurs | Typical UAE Fleet Impact | Measurement Method | Reduction Potential |
| Engine idling | Engine running while vehicle stationary A/C idling, traffic queue idling, waiting for loading, driver breaks with engine on | 8-15% of total fuel consumption; AED 45,000-90,000/year for 50-vehicle fleet at 10% fuel budget | GPS ignition-on with speed = 0 detection; idling duration per vehicle per day | 60-70% reduction from idling alerts and driver coaching AED 27,000-63,000 annual saving |
| Aggressive driving | Harsh acceleration, over-speed driving, harsh braking each increases fuel consumption significantly above efficient driving baseline | 20-35% fuel consumption increase vs efficient driving baseline; AED 90,000-210,000/year excess spend for 50-vehicle fleet | GPS accelerometer events (harsh braking, rapid acceleration), speed vs posted limit, OBD engine load data | 25-35% reduction from eco-driving coaching programme the largest single fuel saving category |
| Fuel theft and card misuse | Siphoning (fuel removed from vehicle tank without engine operation), card sharing (driver using fuel card for personal vehicle or selling fuel), fuel purchased not associated with fleet vehicle | 8-15% of total fuel in unmanaged UAE fleets at first deployment; AED 36,000-90,000/year for 50-vehicle fleet | Fuel sensor level monitoring vs card transaction records; GPS location at fuel purchase vs vehicle location at purchase time | Near-elimination of theft once detection is in place deterrence effect is immediate and near-total |
| Route inefficiency | Vehicles covering more kilometres than optimised routing requires inefficient dispatch decisions, drivers taking longer routes, unauthorised detours | 10-20% excess kilometres vs optimised routing; direct proportional fuel cost increase | GPS route distance vs optimal route calculation for each trip; deviation alerts from authorised routes | 10-15% kilometre reduction from route optimisation dispatch direct fuel saving without behaviour change |
Section 2 Idling Reduction: The Fastest Fuel Saving
Idling reduction is the first fuel saving that UAE fleet operators see after deploying fuel monitoring software because the alert is simple to configure, the driver behaviour change is immediate, and the saving is visible within the first week. A light commercial van engine idling consumes approximately 0.8 to 1.2 litres per hour depending on engine size and A/C load; at UAE commercial diesel prices, this is AED 3 to AED 5 per idling hour. A van that idles for 60 minutes per day across its operating week (traffic queues, waiting at delivery points, A/C idling during breaks) spends AED 15 to AED 25 per week in fuel generating zero vehicle movement AED 780 to AED 1,300 per year per vehicle.
UAE A/C Idling The Largest Idling Category
In UAE summer, a category of idling does not exist in European fleet fuel guides: A/C idling drivers running the engine to power the air conditioning while waiting in a parked vehicle during breaks, meal stops, or waiting periods. A driver who takes a 30-minute lunch break in their van with engine running and A/C on in August accumulates 30 minutes of A/C idling per day the equivalent of 125 hours of idling per year, costing AED 375 to AED 625 in fuel that produces only driver comfort, not vehicle movement. For a 50-vehicle urban delivery fleet, A/C idling alone represents AED 18,750 to AED 31,250 in annual fuel waste a saving that is directly addressed by idling alerts and driver policy on maximum idling duration.
The operationally appropriate idling policy for UAE summer must acknowledge the legitimate welfare dimension: drivers waiting in parked vehicles in 47°C heat without A/C face genuine health risk. A practical policy configures idling alerts to fire after 10 minutes of continuous idling (not 5 minutes, which would fire during legitimate loading/unloading waits) and instructs drivers to use shaded parking where available, open windows during short stops rather than running A/C, and take extended breaks in air-conditioned facilities rather than in the vehicle. This balanced approach reduces A/C idling by 40 to 60 percent without creating heat safety compliance issues.
Traffic Queue Idling in UAE Urban Conditions
UAE urban traffic Dubai’s Sheikh Zayed Road at 8:30 AM, Abu Dhabi’s Corniche Road at 5:30 PM, Sharjah’s industrial area access roads throughout the day generates significant traffic queue idling for commercial fleet vehicles. Unlike A/C idling (where driver behaviour choice determines whether the engine is on), traffic queue idling is a direct function of route selection and departure timing. GPS route data that shows which vehicles accumulate the most queue idling and on which specific routes and at which times enables dispatch management decisions that reduce total queue idling across the fleet: earlier departures that avoid peak congestion, route alternatives that bypass known congestion points, and scheduling adjustments that match delivery timing to lower-traffic windows.
Section 3 Eco-Driving Coaching: The Largest Fuel Saving
Eco-driving coaching using GPS telematics data to identify and modify the aggressive driving behaviours that increase fuel consumption delivers the largest absolute fuel saving of any fuel management intervention, because the same behaviour changes that reduce fuel waste also reduce tyre wear, brake pad consumption, engine wear, and incident risk. The fuel saving and the safety improvement are two outcomes of the same driving behaviour change, produced by the same coaching programme.
The Three Driving Behaviours That Waste Most Fuel
Rapid acceleration from rest and from low speeds is the single largest driver behaviour fuel waste source accelerating aggressively from a traffic stop to 60 km/h consumes 40 to 60 percent more fuel than the same acceleration performed smoothly. GPS accelerometer data detects and records every harsh acceleration event, enabling the fleet manager to identify which drivers are consistently accelerating aggressively and which specific route segments (typically leaving roundabouts, accelerating from red lights, and merging onto motorways) generate the most events. Coaching that targets these specific locations and behaviours ‘on Al Khail Road northbound, you have 8 harsh acceleration events this week, all in the 500 metres after the Umm Suqeim junction’ produces faster behaviour change than generic fuel efficiency advice.
Over-speed driving increases aerodynamic drag exponentially fuel consumption at 120 km/h is approximately 30 to 40 percent higher than at 90 km/h on the same route. UAE federal highway speed limits (100 to 120 km/h for commercial vehicles on E-roads) are frequently exceeded by fleet drivers who treat speed camera locations as the effective speed limit rather than the posted limit. GPS speed monitoring that records speed against posted limits not just against fixed threshold values identifies over-speed fuel waste on each route segment, enabling coaching that targets the specific routes where each driver’s over-speed behaviour is generating the most fuel waste.
Harsh braking typically the result of insufficient following distance rather than genuine emergency wastes the kinetic energy that the vehicle’s fuel expenditure created during acceleration. A driver who accelerates to 80 km/h and then brakes heavily to 20 km/h at a yellow light has consumed fuel to create energy that the braking event discards as heat. GPS harsh braking data identifies drivers with high braking event frequencies and the locations where those events concentrate enabling coaching on following distance, anticipation, and coasting to decelerate rather than late heavy braking.
Targeting the 20 Percent for Maximum ROI
In every UAE commercial fleet with GPS driver behaviour data, the distribution of fuel-wasting events is heavily skewed the top 20 percent of drivers by aggressive driving frequency generate 50 to 65 percent of total harsh events and account for a disproportionate share of above-baseline fuel consumption. Eco-driving coaching that concentrates initial effort on these high-impact drivers rather than applying equal coaching time to all drivers produces the maximum fuel saving per unit of coaching investment. Identifying the top 20 percent is immediate from the weekly driver safety scorecard; coaching the specific behaviours in the GPS event record is the conversation that changes fuel consumption for those drivers faster than any fleet-wide communication.
Section 4 Fuel Theft Detection and Card Management
Fuel theft in UAE commercial fleets occurs in two primary forms: physical siphoning (fuel removed from the vehicle tank using a pump or hose, typically overnight or on unmanned sites) and card misuse (using the company fuel card to fill personal vehicles, selling fuel purchased on the company account, or purchasing fuel in quantities inconsistent with the vehicle’s tank capacity and current level). Both are detectable through the combination of fuel sensor data and fuel card transaction records integrated in the fleet management platform.
Fuel Sensor Integration for Siphoning Detection
A calibrated fuel level sensor installed in the vehicle’s fuel tank transmits real-time fuel level data to the GPS tracking device and fleet management platform. When the fuel level drops without a corresponding engine-on event the vehicle is parked with ignition off but the fuel level is falling the platform generates a siphoning alert within minutes. The alert includes the vehicle’s GPS location, the time the level drop began, and the estimated volume of fuel removed based on the level change and the tank’s calibrated capacity. Fleet managers who receive siphoning alerts are typically discovering a practice that has been occurring for weeks or months before the fuel sensor deployment the deterrence effect on the driver population is immediate and near-total once it is known that siphoning is detected in real time.
Fuel Card Transaction Reconciliation
Fuel card integration in fleet fuel monitoring software matches each fuel card transaction the time, location, volume purchased, and card used against the GPS data for the vehicle associated with the card: was the vehicle at the fuel station location at the time of the transaction? Does the purchase volume match the current fuel level as measured by the fuel sensor (or estimated from the GPS consumption model)? Is the total volume purchased consistent with the vehicle’s tank capacity? Transactions where the vehicle GPS location does not match the fuel station location at the transaction time flag card sharing or card misuse the driver used the card at a fuel station the vehicle was not at, indicating personal vehicle use or commercial resale of the fuel. VZone International’s fleet platform reconciles fuel card transactions against GPS vehicle location data automatically, flagging exceptions for fleet manager review rather than requiring manual cross-referencing of two data sources.
Section 5 Fleet Fuel Monitoring ROI for UAE Operators
| Saving Category | Mechanism | Conservative Saving Rate | Annual Saving 50-Vehicle Fleet (AED) |
| Idling reduction | Idling alerts and driver policy 65% reduction in idling time | 65% of AED 60,000 annual idling cost (50 vehicles × AED 1,200/year) | AED 39,000 |
| Eco-driving fuel consumption reduction | Coaching top 20% of drivers; 25% consumption reduction from behaviour change | 25% of AED 500,000 fuel budget less idling saving | AED 115,250 |
| Fuel theft elimination | Fuel sensor siphoning detection + card reconciliation near-elimination after detection deployed | 10% of AED 500,000 fuel budget (conservative theft estimate) | AED 50,000 |
| Route optimisation | 10% kilometre reduction from optimised dispatch | 10% of AED 500,000 fuel budget less above savings | AED 29,575 |
| Tyre and maintenance saving from eco-driving | Same behaviour change reduces tyre wear (15%) and brake pad consumption (20%) | Per-category maintenance saving from Cat-39 and Cat-35 | AED 28,000 |
| TOTAL ANNUAL SAVING | AED 261,825 |
Fuel Monitoring Software ROI 50-Vehicle UAE Fleet Platform cost (fuel monitoring included in fleet management platform subscription): AED 30,000-60,000/year for 50 vehiclesFuel sensor installation (if required): AED 400-800 per vehicle one-timeTotal Year 1 investment: AED 50,000-100,000Annual fuel saving (conservative): AED 261,825Payback period: 2-4 months24-month net ROI: AED 423,650-523,650Note: The eco-driving behaviour change that saves fuel in Year 1 compounds into Year 2 drivers who have improved their safety scores maintain the improvement, and the Year 2 fuel saving is achieved with less intensive coaching than Year 1. |
Section 6 Implementing Fleet Fuel Monitoring in UAE
Step 1 Establish the Baseline
Before configuring fuel saving interventions, establish each vehicle’s current fuel consumption baseline: total fuel purchased per month (from fuel card records), total kilometres driven per month (from GPS data), and calculated fuel consumption per 100 km (total fuel / total distance × 100). This baseline is the reference against which all fuel saving is measured without it, the fleet manager cannot quantify the saving that the monitoring programme delivers. The baseline calculation also immediately identifies vehicles with anomalous consumption profiles (consumption significantly above category benchmark) that warrant investigation before the coaching programme begins.
Step 2 Configure Idling and Driving Behaviour Alerts
Configure idling alerts to fire after 10 minutes of continuous engine-on with speed = 0 (or 5 minutes for vehicles with no legitimate extended idling requirement). Configure harsh acceleration, harsh braking, and over-speed alerts at thresholds appropriate for the vehicle category light vans, heavy trucks, and construction vehicles have different appropriate sensitivity settings. Configure weekly driver fuel efficiency scores alongside the existing safety scores fuel consumption per 100 km normalised for route type provides the per-driver efficiency metric that enables coaching conversations to be fuel-specific rather than generic.
Step 3 Deploy Fuel Sensor Integration (Where Required)
For fleets where fuel theft is suspected or where card reconciliation alone is insufficient particularly for vehicles that are frequently parked overnight on unmanned construction sites install calibrated fuel level sensors and integrate sensor data with the fleet platform. The fuel sensor installation adds AED 400 to AED 800 per vehicle for a one-time hardware cost, with the payback measured in weeks for fleets where siphoning is occurring. For fleets where card reconciliation provides adequate theft detection (urban delivery vans that return to depot each night), fuel sensors may not be required for all vehicles.
Step 4 Run the Coaching Programme
Weekly driver fuel efficiency scorecard review targeting the top 20 percent by fuel consumption is the coaching programme element that drives the largest fuel saving. The coaching conversation for fuel efficiency uses the same GPS event data as the safety coaching conversation: specific harsh acceleration events on specific route segments, over-speed frequency on specific roads, idling duration at specific locations. Route optimisation review comparing actual GPS routes against optimal routes for each trip identifies drivers who consistently take longer routes and the specific diversions that add distance and fuel cost. For fleets that combine fuel efficiency and safety coaching, the same weekly review covers both topics using the same GPS data source.
VZone International Fuel Monitoring Software 20-30% Fuel Cost Reduction for UAE Fleets
VZone International’s fleet management platform includes GPS telematics-based fuel monitoring with idling alerts, eco-driving scoring, fuel sensor integration, fuel card reconciliation, and driver fuel efficiency coaching tools for UAE commercial fleets from 10 to 500+ vehicles. Fuel monitoring is included in the standard Wialon platform deployment. Contact our team for a fuel waste assessment and ROI calculation for your UAE fleet.
Frequently Asked Questions
Fleet fuel monitoring software combines GPS telematics data with fuel consumption data from one or more sources OBD-II engine parameters, calibrated fuel level sensors, or fuel card transaction records to provide per-vehicle fuel consumption visibility across the fleet. GPS data provides the driving behaviour inputs (idling time, speed profiles, harsh event frequency, total route distance) that explain why fuel consumption is high or low for each vehicle. Fuel sensor or card data provides the actual volume consumed, enabling calculation of fuel consumption per 100 km per vehicle. The fleet management platform compares each vehicle's actual consumption against its baseline and category benchmark, flags significant deviations for investigation, generates driver fuel efficiency scores for coaching, and produces fleet-level fuel reports for financial management and budget tracking. VZone International's Wialon platform integrates GPS telematics, OBD fuel system data, fuel sensor inputs, and fuel card data in a unified fuel monitoring module.
UAE commercial fleets consistently achieve 20 to 30 percent fuel cost reduction within 12 months of deploying fuel monitoring software with a systematic coaching programme. The saving range reflects the fleet's starting condition: fleets with high idling rates, aggressive driver populations, and undetected fuel theft at baseline achieve the upper end (25 to 30 percent); well-managed fleets with existing discipline achieve the lower end (15 to 20 percent). The 20 to 30 percent saving estimate is supported by VZone International's deployment data across 4,000+ UAE fleet clients clients with 50 vehicles saving AED 100,000 to AED 180,000 annually, and clients with 200 vehicles saving AED 400,000 to AED 720,000 annually, representing 2 to 4 month payback periods on platform investment. The saving is sustained and compounds because the behaviour changes achieved through coaching tend to be durable drivers who have developed more efficient driving habits maintain them after the intensive coaching period.
Fuel theft in UAE fleet vehicles is detected through two mechanisms that work in combination. Calibrated fuel level sensors installed in the vehicle's fuel tank transmit real-time fuel level data to the fleet management platform when the fuel level falls without a corresponding engine-on event (the vehicle is parked but losing fuel), the platform generates a siphoning alert within minutes with the vehicle's GPS location and estimated volume of fuel removed. Fuel card transaction reconciliation compares each card transaction against the GPS data: was the vehicle at the fuel station location at the time of the transaction? Does the volume purchased match the vehicle's current fuel level and tank capacity? Transactions where the vehicle GPS location does not match the fuel station location at purchase time flag card misuse the card was used at a location the vehicle was not present at. Most UAE fleet operators who deploy fuel monitoring discover that 8 to 15 percent of their fuel budget was being stolen or misused before detection was in place.
Fleet fuel monitoring software is financially justified for UAE commercial fleets as small as 10 vehicles, provided the fleet operates a reasonable annual mileage. For a 10-vehicle fleet spending AED 100,000 per year on fuel, a 25 percent saving is AED 25,000 annually against a platform cost of AED 6,000 to AED 12,000 per year for 10 vehicles. Payback is achieved within 3 to 6 months. The case is stronger when fuel theft is suspected (a single fuel theft situation resolved by sensor detection can pay for the sensors in weeks), or when idling and aggressive driving are visible problems that the fleet manager knows exist but cannot currently quantify or address systematically. For very small fleets (under 5 vehicles) where the fleet manager has direct daily visibility of each vehicle and driver, the marginal value of automated monitoring is lower but still positive if any of the four waste sources described in this article apply to the fleet.