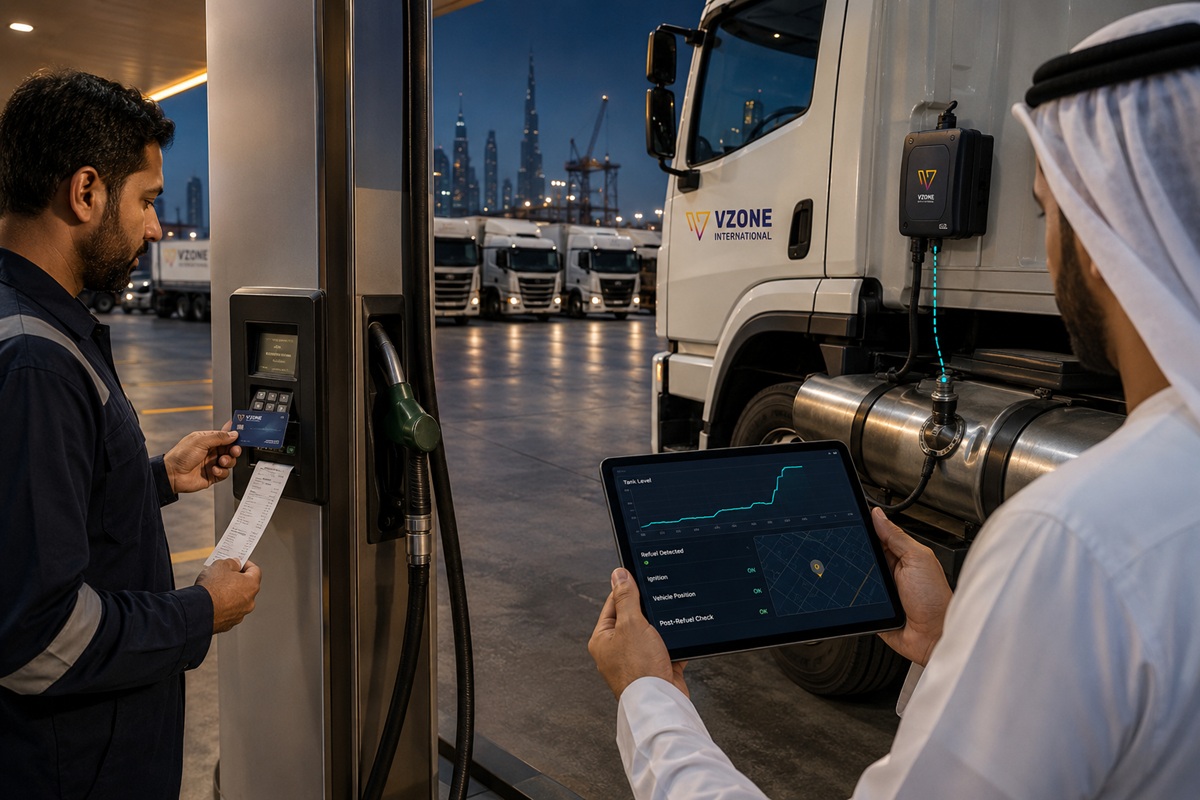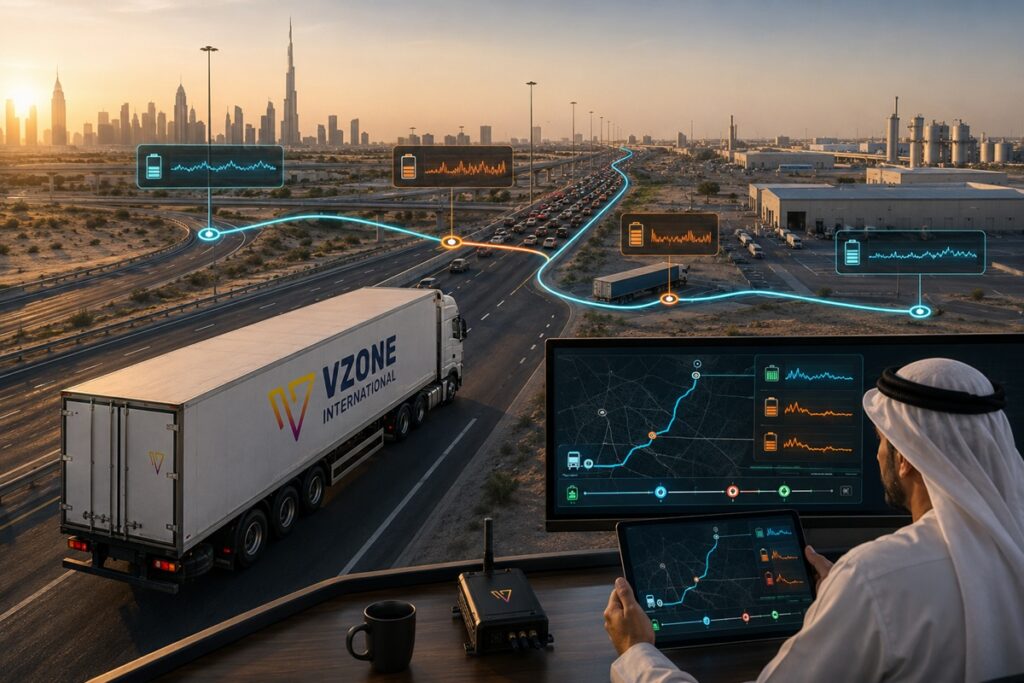
Heavy truck fuel is not just the largest operating cost in UAE logistics it is also the most difficult to manage without per-route, per-driver data. A transport manager who knows the fleet consumed 120,000 litres of diesel in October knows nothing useful about where the consumption went. Which routes have the highest fuel cost per kilometre? Which drivers are consuming 30 percent more fuel than their colleagues on the same routes? How much of the monthly fuel spend is attributable to specific client contracts? Without per-route GPS fuel tracking, these questions cannot be answered and without the answers, fuel management is limited to monitoring the total spend without understanding what is driving it.
GPS fuel monitoring for heavy trucks in UAE integrates CAN bus vehicle data (fuel level, instantaneous consumption rate, engine load, AdBlue level, tyre pressure where TPMS is active) with GPS trip data (distance, route, speed profile, idling time) to produce per-route, per-driver, and per-load consumption records. For UAE long-haul logistics operators covering Dubai-Abu Dhabi-Muscat-Riyadh corridors, this data transforms fuel management from a monthly invoice exercise into a continuous optimisation programme with measurable financial outcomes.
Key Takeaways
- Heavy truck fuel monitoring requires CAN bus integration not OBD-II alone because heavy commercial vehicles communicate fuel level, consumption rate, and engine performance through the CAN bus network in a vehicle-manufacturer-specific format that provides richer and more accurate data than the standardised OBD-II parameter set designed for lighter vehicles.
- Per-route fuel consumption tracking enables the comparison that identifies efficiency opportunities: two drivers running the same Dubai-Muscat route in the same truck model with the same load should produce similar consumption figures when Driver A consistently achieves 38 L/100 km and Driver B consistently achieves 46 L/100 km, the GPS data explains the gap through speed profiles, harsh event frequency, and idling duration at borders.
- Load-adjusted consumption benchmarking accounts for the most significant variable in heavy truck fuel consumption load weight. A truck running fully loaded (25-tonne payload) consumes 35 to 45 percent more fuel per kilometre than the same truck running empty or half-loaded. GPS fuel monitoring that records load data alongside consumption produces load-normalised benchmarks that enable fair driver comparison regardless of load variation between trips.
- UAE-Oman-Saudi Arabia route fuel management has unique considerations: border crossing idling (UAE-Oman Al Ain border can add 1 to 3 hours of idling per crossing), cross-border fuel price differentials (Oman diesel is significantly cheaper than UAE diesel trip planning that maximises Oman filling reduces per-trip fuel cost), and OPAL compliance fuel data requirements for Oman-operating trucks.
- AdBlue (Diesel Exhaust Fluid) monitoring alongside diesel fuel monitoring is increasingly important for UAE heavy trucks with Euro 5 or Euro 6 emissions systems AdBlue depletion triggers engine dereating (reduced power output) and, in some truck models, eventual engine shutdown. GPS platforms with CAN bus AdBlue level monitoring alert fleet managers to low AdBlue before performance impact occurs.
Section 1 Why Truck Fuel Monitoring Requires CAN Bus, Not Just OBD-II
Light commercial vehicles vans, pickup trucks, passenger cars use the OBD-II diagnostic standard, which provides a standardised set of fuel-related parameters through the 16-pin diagnostic port: fuel system status, calculated fuel consumption, fuel trim values, and throttle position. Heavy commercial trucks semi-trailers, rigid body trucks above 3.5 tonnes GVW, buses use a different communication architecture: the CAN bus (Controller Area Network), which is a manufacturer-specific vehicle data network carrying richer information than OBD-II but in a format that requires vehicle-specific CAN database software to interpret.
What CAN Bus Provides for Truck Fuel Monitoring
CAN bus integration for heavy truck fuel monitoring provides data categories that OBD-II cannot deliver for these vehicle classes. Fuel level from the truck’s own tank level sensor more accurate than OBD-II fuel system calculations for the large, complex tank configurations on heavy trucks (saddle tanks, twin tanks, extended range tanks). Instantaneous fuel consumption rate the current litres-per-hour consumption as calculated by the truck’s engine management system in real time, enabling accurate trip consumption calculation without relying on fill-to-fill estimation. Engine load percentage the proportion of maximum engine output currently being demanded, which is the primary determinant of instantaneous fuel consumption and enables coaching identification of high-load driving patterns that increase consumption. Vehicle speed from the transmission more accurate than GPS speed for multi-tier speed event classification in ADNOC IVMS reporting, and the standard source for truck tachograph speed data. Tyre pressure monitoring data where TPMS is integrated in the truck’s CAN network. AdBlue level and consumption rate for Euro 5 and Euro 6 trucks.
CAN Database Configuration for UAE Truck Fleet Brands
CAN bus interpretation requires a vehicle-specific database that maps the CAN data frame format to human-readable parameters what position 3 of CAN frame ID 0x1F0 means for a Volvo FH16 is different from what the same position means for a MAN TGX or a Mercedes-Benz Actros. VZone International’s Teltonika GPS devices support CAN bus integration with databases for all major UAE heavy truck brands Volvo, MAN, Mercedes-Benz Actros, Scania, DAF, Isuzu, and Hino with the vehicle-specific database loaded during device installation. The fleet manager sees fuel level, consumption rate, and engine load data in the Wialon platform dashboard using the correct units and scaling for the specific truck model no translation required.
Section 2 Per-Route Fuel Consumption Tracking
Per-route fuel consumption tracking is the analytical capability that transforms raw fuel data into actionable fleet management intelligence. When each trip is tagged with route identity, driver identity, load weight, and cargo type, the accumulated database of trip records enables multi-dimensional consumption analysis that fleet managers with monthly invoice totals cannot approach.
The Route Baseline How It Is Built
A route baseline is the established expected fuel consumption range for a specific route under normal operating conditions expressed as litres per 100 km and total litres per trip, with upper and lower bounds that reflect the normal variation from load weight, traffic conditions, and seasonal temperature variation. Building a route baseline requires accumulating 8 to 12 completed trips on the route before the baseline is statistically valid the first 3 to 4 trips provide a preliminary indication but may be skewed by unusual conditions. VZone International’s fleet platform automatically calculates route baselines from GPS trip history, updating the baseline as new trip data accumulates and flagging trips that deviate significantly above or below the established range.
For UAE-GCC long-haul routes, the route baseline accounts for the specific fuel characteristics of each route segment: urban sections (higher consumption from stop-start, lower average speed), highway sections (lower consumption at efficient cruising speed), mountain sections (higher consumption from gradient climb particularly relevant for UAE-Oman routes through the Hajar Mountains via Hatta), and border crossing sections (high idling consumption during inspection and clearance). A complete Dubai-Muscat route baseline differentiates these segments so that a driver who takes 2 hours at the border crossing is compared against the segment-specific baseline rather than penalised by a route-average that assumes efficient border crossing time.
Driver Comparison on Identical Routes
Driver comparison on identical routes is the most powerful fuel management insight that per-route tracking enables and the one that most directly identifies coaching opportunity. When the fleet platform shows that on the Dubai-Abu Dhabi E11 corridor, Driver A consistently achieves 28 L/100 km and Driver B consistently achieves 36 L/100 km in the same truck model with similar loads, the 28 percent consumption gap represents a coaching opportunity worth AED 2,500 to AED 4,000 per month for that route frequency. The GPS data explains the gap: Driver B has 4× the harsh acceleration events of Driver A on the Abu Dhabi approach, drives 8 km/h faster on average across the highway section, and accumulates 35 more minutes of idling at the delivery point. These three behaviours account for the consumption difference and the coaching conversation addresses each specifically.
Section 3 UAE Truck Fuel Benchmarks by Route Type
| Route Type | Vehicle Category | Expected Consumption Range (L/100km) | Key Consumption Variables | UAE-Specific Factors |
| Dubai urban delivery (multi-drop) | Rigid truck 12-18t GVW | 22-32 L/100km | Stop-start frequency, load weight, idling at delivery points | UAE peak hour traffic significantly increases consumption vs off-peak; A/C load adds 10-15% in summer |
| Dubai-Abu Dhabi E11 highway | Semi-trailer 40t GCW | 28-38 L/100km | Speed profile, load weight, wind conditions, A/C | Headwind on E11 can add 5-8% consumption; fully loaded vs empty return dramatically different |
| Dubai-Al Ain E66/E22 | Rigid truck 18-24t GVW | 32-42 L/100km | Gradient sections, speed, load | Mountain approach to Al Ain adds gradient consumption; return journey significantly more efficient |
| UAE-Oman (via Al Ain/Buraimi) | Semi-trailer 40t GCW | 34-46 L/100km trip average | Border crossing idling (1-4 hours), Hajar Mountain gradient, Oman highway speed profile | Border crossing adds 15-30L idling per crossing; Oman lower diesel price fill in Oman where possible |
| UAE-Saudi Arabia (via Abu Dhabi/Ghuwaifat) | Semi-trailer 40t GCW | 30-40 L/100km | Long highway section, Saudi border crossing idling, desert wind | Saudi Arabia border crossing can add 3-6 hours idling; fill UAE before border; Saudi diesel cheaper |
| Abu Dhabi Western Region (ADNOC sites) | Pickup/rigid truck | 28-40 L/100km | Desert track sections, sand, site access conditions | Desert track adds up to 30% vs paved route; ADNOC site access may require specific route adding distance |
Section 4 Load-Adjusted Fuel Monitoring
Load weight is the most significant variable in heavy truck fuel consumption more significant than driver behaviour or route type for the same driver on the same route. A fully loaded 40-tonne GCW semi-trailer on the E11 highway consumes 35 to 45 percent more fuel per kilometre than the same truck running empty on the same highway at the same speed. Any fuel efficiency comparison that does not account for load weight will systematically misidentify heavily-loaded drivers as inefficient and lightly-loaded drivers as efficient, generating coaching conversations based on misleading data.
Load Data Integration
Load data integration for fuel monitoring connects the truck’s load record from the dispatch system, the weighbridge record, or the driver’s trip sheet with the GPS trip data and fuel consumption record. When each trip is tagged with the load weight at departure and the load weight at delivery (for multi-drop routes where load decreases through the route), the fleet management platform calculates load-adjusted consumption: the fuel efficiency performance normalised for the load carried. Two drivers with identical load-adjusted consumption scores are performing equivalently regardless of whether one carried 25 tonnes and the other carried 15 tonnes on their most recent trips.
For fleets without weighbridge data, load category approximation empty, half-load, three-quarter load, full load provides a cruder but still useful normalisation that reduces the load-weight bias in driver comparison. Drivers self-report load category at trip start in the driver app; the fleet platform applies the load category adjustment to the consumption per km for that trip. This manual load input is less accurate than weighbridge integration but significantly more informative than no load adjustment at all.
Return Trip Fuel Optimisation
Return trips trucks running empty or lightly loaded back to origin after delivering full loads represent a specific fuel optimisation opportunity that per-route monitoring identifies. Empty running fuel consumption is 35 to 45 percent lower per kilometre than full-load consumption, but empty return routes are also the routes where drivers are most likely to increase speed above efficient cruise speed (without load stress on the vehicle) and where idling at depot return is most likely (waiting for next assignment). GPS monitoring for empty return trips identifies whether drivers are exploiting the lighter vehicle condition to over-speed, and whether depot return idling is accumulating during the wait for next dispatch two behaviours that erode the inherent fuel efficiency advantage of the empty return.
Section 5 Cross-Border Fuel Strategy for UAE-GCC Truck Fleets
UAE-GCC truck routes offer a specific fuel cost optimisation opportunity that GPS route data enables: cross-border diesel price differentials. Diesel prices in Oman, Saudi Arabia, and other GCC countries differ from UAE diesel prices sometimes significantly and trip planning that takes advantage of lower diesel prices in adjacent countries can reduce per-trip fuel cost by AED 500 to AED 2,000 for a long-haul crossing, depending on the price differential and the fill volume.
UAE-Oman Fuel Strategy
Oman diesel prices are typically lower than UAE diesel prices the differential varies with oil price cycles but has historically favoured Oman filling for UAE trucks making the crossing. A Dubai-Muscat truck that fills its saddle tanks to maximum before leaving UAE (benefiting from known UAE fuel quality and station reliability) and then fills again in Oman for the return leg (or fills to sufficient for the return journey at the Oman destination) can optimise the balance between UAE quality assurance and Oman cost advantage. GPS route data shows the actual fuel level at the Oman border crossing enabling the fleet manager to advise drivers on optimum fill strategy rather than leaving it to each driver’s discretion, which produces highly variable and often suboptimal results.
Border Crossing Idling The Hidden Fuel Cost
UAE-Oman and UAE-Saudi Arabia border crossings are the largest concentrated idling events in GCC truck route operations. Depending on the day of the week, time of day, and seasonal demand, UAE-Oman Al Ain/Buraimi crossing idling can range from 45 minutes to 3 hours; UAE-Saudi Arabia Ghuwaifat crossing can range from 1 hour to 6 hours. A fully loaded semi-trailer idling at a border crossing at 4.5 L/hour for 2.5 hours consumes 11.25 litres AED 20 to AED 23 per crossing in pure idling fuel. For a truck making 12 UAE-Oman crossings per month, border idling costs AED 240 to AED 280 per month AED 2,880 to AED 3,360 per year in unavoidable idling that must be budgeted and tracked but cannot be eliminated by driver coaching. GPS monitoring that tags border crossing idling separately from other idling categories enables accurate cost attribution border idling is a route cost, not a driver behaviour cost.
VZone International GPS Fuel Monitoring for UAE Truck Fleets CAN Bus, Per-Route, Per-Driver
VZone International integrates CAN bus fuel data (fuel level, consumption rate, engine load, AdBlue) with GPS trip tracking for UAE heavy truck fleets providing per-route consumption benchmarks, driver comparison reports, load-adjusted efficiency scoring, and cross-border fuel strategy data. Teltonika CAN bus devices support all major UAE truck brands. Contact our team for a truck fuel monitoring assessment for your UAE fleet.
Frequently Asked Questions
Per-route fuel consumption monitoring for UAE trucks uses GPS trip data combined with CAN bus fuel data from the truck's vehicle network. The GPS device records the start and end point of each trip, the total distance driven, the route taken, and the speed profile throughout the journey. The CAN bus integration reads the fuel level at trip start and trip end (or continuously throughout the trip for more accurate consumption calculation), enabling calculation of litres consumed per 100 km for each specific trip. When each trip is tagged with the route identifier, driver, load weight, and date in the fleet management platform, the accumulated database enables comparison of consumption across all trips on the same route identifying which drivers are most efficient on each route and which trips deviated from the route baseline. VZone International's Wialon platform generates per-route consumption reports automatically from the GPS and CAN bus data, with no manual fuel recording required from drivers.
Average fuel consumption for heavy trucks in UAE depends significantly on route type, load weight, and vehicle configuration. As reference benchmarks: a 40-tonne GCW semi-trailer on UAE-Abu Dhabi E11 highway running fully loaded typically achieves 28 to 38 L/100 km; the same truck on urban Dubai multi-drop delivery achieves 35 to 50 L/100 km from stop-start traffic. A 24-tonne rigid truck on mixed urban and highway UAE routes achieves 22 to 32 L/100 km loaded. UAE summer heat adds 10 to 15 percent to these benchmarks from A/C load and cooling system demand. GPS fuel monitoring for a UAE truck fleet establishes per-vehicle, per-route baselines from actual operational data within the first 4 to 8 weeks of deployment these actual baselines are more accurate for budget and coaching purposes than generic benchmarks, because they reflect the specific truck models, routes, loads, and drivers in the fleet.
Yes UAE truck fleets consistently achieve 15 to 25 percent fuel cost reduction within 12 months of GPS fuel monitoring deployment with a systematic driver coaching programme. The saving comes from three sources applied simultaneously: eco-driving behaviour change (the largest component reducing aggressive acceleration, maintaining efficient cruise speed, and reducing idling at borders and delivery points), route optimisation (eliminating unnecessary kilometres from inefficient dispatch and driver route choices), and cross-border fuel strategy optimisation (taking advantage of lower diesel prices at GCC destination filling points rather than leaving fill decisions to individual drivers). For a heavy truck fleet with AED 20,000 per truck per month in fuel cost, a 20 percent reduction saves AED 4,000 per truck per month AED 48,000 per truck per year, recovered in platform and monitoring costs within 4 to 6 weeks.
AdBlue (also known as Diesel Exhaust Fluid or DEF) is the urea solution used in Selective Catalytic Reduction (SCR) emissions systems on Euro 5 and Euro 6 heavy trucks to reduce nitrogen oxide emissions. UAE's commercial vehicle fleet increasingly includes Euro 5 and Euro 6 trucks as new vehicle standards tighten, and these trucks require AdBlue to operate within regulatory emissions limits. When AdBlue runs low, the truck's engine management system first triggers a warning, then progressively derates engine power (reducing maximum speed and power output), and in some truck models eventually prevents engine restart after shutdown until AdBlue is refilled. On UAE-GCC long-haul routes where AdBlue availability at fuel stations is less consistent than in European markets, running low on AdBlue can cause a truck to be stranded on a remote highway or at a border crossing without the correct fluid available. GPS fleet monitoring with CAN bus AdBlue level integration alerts fleet managers when any truck's AdBlue level falls below a configured threshold typically 20 to 25 percent enabling the driver to be instructed to refill at the next available point rather than discovering the derating warning in the cab at a remote location.